UNIT 2 MILESTONE 2 INTRO TO STATS
WITH ANSWERS
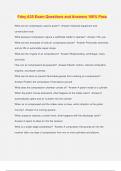
The midterm exam scores obtained by boys and girls in a class
are listed in the table below
What does the circled section represent?
Twelve boys scored 8 marks on the exam.
Two boys scored between 80 and 89 marks on the exam.
Eight boys scored over 10 marks on the exam.
Eight boys scored 12 marks on the exam. - CORRECT
ANSWER-If we recall that the stem and leaf can give us the
actual values in the data set, then the circle corresponds to 81
and 82. We can then note that there are two scores from boys
between 80 and 89.
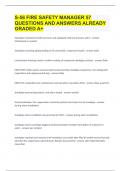
Sara wonders what percentage of her students answered at
least half of the quiz questions incorrectly.
The cumulative frequency of students who earned a score of 20
or lower on the quiz is __________. - CORRECT ANSWER-To
get cumulative frequency of 20 or less, we simply add up any
bin that has the number 20 or less, such as the bin that shows
scores of 1-5, 6-10, 11-15, and 16-20.
In which of these cases should mode be used?
When the data has extreme values
When the data is represented using ratio scale
When the data is represented using interval scale
When the data is qualitative and we talk about the most
frequent category - CORRECT ANSWER-If the data is
qualitative, it is only descriptive. In this case, the mode is a
good measure since the mode examines the most frequently
occurring value. The data can be non-numeric.
WITH ANSWERS
The midterm exam scores obtained by boys and girls in a class
are listed in the table below
What does the circled section represent?
Twelve boys scored 8 marks on the exam.
Two boys scored between 80 and 89 marks on the exam.
Eight boys scored over 10 marks on the exam.
Eight boys scored 12 marks on the exam. - CORRECT
ANSWER-If we recall that the stem and leaf can give us the
actual values in the data set, then the circle corresponds to 81
and 82. We can then note that there are two scores from boys
between 80 and 89.
Sara wonders what percentage of her students answered at
least half of the quiz questions incorrectly.
The cumulative frequency of students who earned a score of 20
or lower on the quiz is __________. - CORRECT ANSWER-To
get cumulative frequency of 20 or less, we simply add up any
bin that has the number 20 or less, such as the bin that shows
scores of 1-5, 6-10, 11-15, and 16-20.
In which of these cases should mode be used?
When the data has extreme values
When the data is represented using ratio scale
When the data is represented using interval scale
When the data is qualitative and we talk about the most
frequent category - CORRECT ANSWER-If the data is
qualitative, it is only descriptive. In this case, the mode is a
good measure since the mode examines the most frequently
occurring value. The data can be non-numeric.