Resume
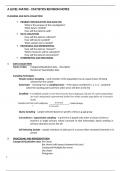
Pearson Edexcel A Level Maths - Statistics Summary Sheets
- Cours
- Établissement
Struggling to keep track of all the key concepts in the Statistics section of A Level Maths? These concise, easy-to-understand summary sheets are designed to help you master the most important topics quickly and efficiently. What’s included: - Clear explanations of key statistical concepts ...
[Montrer plus]