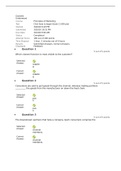
Sophia Learning STAT1001: Introduction to Statistics Final Milestone Test Answered Attempt score 88% Fall 2024/2025.
11 views 0 purchase
Course
Sophia Learning STAT1001: Intro to Statistics
Institution
Sophia Learning STAT1001: Intro To Statistics
1
22/25 that's 88% RETAKE
22 questions were answered correctly.
3 questions were answered incorrectly.
Jesse takes two data points from the weight
and feed cost data set to calculate a slope, or
average rate of change. A rat weighs 3.5
pounds and costs $4.50 per week to feed,
while ...
22 questions were answered correctly.
3 questions were answered incorrectly.
1
●
Jesse takes two data points from the weight
and feed cost data set to calculate a slope, or
average rate of change. A rat weighs 3.5
pounds and costs $4.50 per week to feed,
while a Beagle weighs 30 pounds and costs
$9.20 per week to feed.
Using weight as the explanatory variable, what
is the slope of the line between these two
points? Answer choices are rounded to the
nearest hundredth.
$1.60 / lb.
●
https://app.sophia.org/spcc/introduction-to-statistics-2/milestone_take_feedbacks/33814809 6/14/24, 9 12 AM
Page 1 of 41
:
, $5.64 / lb.
●
$0.31 / lb.
●
$0.18 / lb.
#
RATIONALE
In order to get slope, we can use the formula:
.
Using the information provided, the two
points are: (3.5 lb., $4.50) and (30 lb., $9.20).
We can note that:
CONCEPT
→ Linear Equation Algebra Review
2
●
Which of the following is a guideline for
establishing causality?
https://app.sophia.org/spcc/introduction-to-statistics-2/milestone_take_feedbacks/33814809 6/14/24, 9 12 AM
Page 2 of 41
:
, Do not consider
other possible
●
causes.
Check if the effect is
present when the
● response variable is
absent.
Keep all variables the
same to get duplicate
●
results.
Look for cases where
correlation exists
between the
#
variables of a
scatterplot.
RATIONALE
Recall that correlation is not sufficient alone to
assess causality, however it is necessary. So
for something to be causal, it must have a
strong association.
https://app.sophia.org/spcc/introduction-to-statistics-2/milestone_take_feedbacks/33814809 6/14/24, 9 12 AM
Page 3 of 41
:
, CONCEPT
→ Establishing Causality
3
●
Joe is measuring the widths of doors he bought
to install in an apartment complex. He
measured 72 doors and found a mean width of
36.1 inches with a standard deviation of 0.3
inches. To test if the doors differ significantly
from the standard industry width of 36 inches,
he computes a z-statistic.
What is the value of Joe's z-test statistic?
2.83
#
-2.83
●
-1.81
●
1.81
●
https://app.sophia.org/spcc/introduction-to-statistics-2/milestone_take_feedbacks/33814809 6/14/24, 9 12 AM
Page 4 of 41
:
The benefits of buying summaries with Stuvia:
Guaranteed quality through customer reviews
Stuvia customers have reviewed more than 700,000 summaries. This how you know that you are buying the best documents.
Quick and easy check-out
You can quickly pay through credit card or Stuvia-credit for the summaries. There is no membership needed.
Focus on what matters
Your fellow students write the study notes themselves, which is why the documents are always reliable and up-to-date. This ensures you quickly get to the core!
Frequently asked questions
What do I get when I buy this document?
You get a PDF, available immediately after your purchase. The purchased document is accessible anytime, anywhere and indefinitely through your profile.
Satisfaction guarantee: how does it work?
Our satisfaction guarantee ensures that you always find a study document that suits you well. You fill out a form, and our customer service team takes care of the rest.
Who am I buying these notes from?
Stuvia is a marketplace, so you are not buying this document from us, but from seller Topscorer. Stuvia facilitates payment to the seller.
Will I be stuck with a subscription?
No, you only buy these notes for $18.04. You're not tied to anything after your purchase.