BAM212 Exam Business statistics with correct answers
Business statistics
All for this textbook (16)
Written for
Jomo Kenyatta University
BAM 212
All documents for this subject (1)
Seller
Follow
Studycenter
Content preview
MODEL QUESTION PAPER – SET 1
Business Statistics (20MBA14)
Note: 1) Answer any 4 full questions from Q.No. 1 to Q.No. 7
2) Part – B, Q.No. 8 is compulsory
Part – A
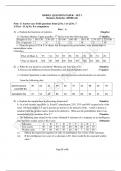
1) a. Explain the functions of statistics. (3marks)
b. Calculate Median, Upper quartiles, 3rd Decile from the following data: (7 marks)
Heights in Cm 145-150 150-155 155-160 160-165 165-170 170-175 175-180
No. of persons 2 4 12 22 30 25 10
c. From the prices of X & Y of shares A& B respectively given below, state which share is
morestablein value.
(10marks)
Price of Share A 55 54 52 53 56 58 52 50 51 49
Price of share B 108 107 105 105 106 107 104 103 104 101
2) a. What do you mean by correlation? Mention any four uses of it? (3marks)
b. Discuss the difference between Parametric and Non-Parametric tests? (7 marks)
c. Calculate Spearman’s rank correlation co-efficient between advertisement cost and sales
3) a. Explain the significance in measuring dispersion? (3marks)
b. In a bolt factory, machines A, B and C manufacture 25%, 35% and 40% respectively of the
total. Of their output 5, 4 and 2 percent are known to be defective bolts. A bolt is drawn at
random from the product and is found to be defective. What are the probabilities that it was
manufactured by machines B or C ? (7marks)
c. The following data related to the scores obtained 9 salesmen of a company in an intelligence
test and their weekly sales in Rs (‘ooo). (10marks)
Salesman A B C D E F G H I
Test scores 50 60 50 60 80 50 80 40 70
Weekly sales 30 60 40 50 60 30 7 50 60
(i) Obtain the regression equation of sales on intelligence test scores of the salesman.
(ii) If the intelligence test score of a salesman is 65, what would be his expected weekly
sales?
Page 17 of 31
, 4) a. What is Poisson’s distribution? Mention 2 application of Poisson distribution. (3marks)
b. calculate Rank Correlation co-efficient between marks assigned to 10 students by judges
X & Y in a certain competitive test. (7marks)
Marks given by judge X 52 53 42 60 45 41 37 38 25 27
Marks given by judge Y 65 68 43 38 77 48 35 30 25 50
c. (i) A cyclist pedals from his house to his college at a speed of 10 km/hr and back from
college to his house at 15 km/hr. Find the average speed. (5 marks)
(ii) If the A.M. of two observations is 127.5 & their G.M. is 60. Find (i) Their H.M. & (II)
two observations. (5 marks)
5) a. What do you mean by correlation? Mention any four uses of it? (3 marks)
b. The mean and standard deviation of a set of 100 observations were worked out as 40 and 5
respectively by a computer which by mistake took value 50 in place of 40 for one
observation. Find the correct mean and standard deviation (7 marks)
c. Goals scored by two teams A & B in a football season are given below. Find the more
consistent team. (10 marks)
No. of goals 0 1 2 3 4 5
Team A 27 9 8 5 4 1
Team B 17 9 6 5 3 2
6) a. Define time series analysis? Mention the methods used for the study and measurement of
trend in time series ? (3 marks)
b. Explain the Procedure of hypothesis test described various stages involved. (7 marks)
c. Mysuru Mahanagar Palike surveyed the travel preferences of people who travelled to work
by train or bus. The initial analysis suggested that 1 in 5 people travelled by train to work. If
5 people are interviewed, what is the probability that,
i) Exactly 3 prefer travelling by train
ii) Three or more prefer travelling by train and
iii) Less than 3 prefer travelling by train. (10marks)
7) a. What is hypothesis? Mention the types of hypothesis testing? (3 marks)
b. From the following series of annual data, find the trend line by the method of semi-averages.
Also estimate the value for 1999. (7 marks)
Year 1990 1991 1992 1993 1994 1995 1996 1997 1998
Actual value 170 231 261 267 278 302 299 298 340
Page 18 of 31
The benefits of buying summaries with Stuvia:
Guaranteed quality through customer reviews
Stuvia customers have reviewed more than 700,000 summaries. This how you know that you are buying the best documents.
Quick and easy check-out
You can quickly pay through credit card or Stuvia-credit for the summaries. There is no membership needed.
Focus on what matters
Your fellow students write the study notes themselves, which is why the documents are always reliable and up-to-date. This ensures you quickly get to the core!
Frequently asked questions
What do I get when I buy this document?
You get a PDF, available immediately after your purchase. The purchased document is accessible anytime, anywhere and indefinitely through your profile.
Satisfaction guarantee: how does it work?
Our satisfaction guarantee ensures that you always find a study document that suits you well. You fill out a form, and our customer service team takes care of the rest.
Who am I buying these notes from?
Stuvia is a marketplace, so you are not buying this document from us, but from seller Studycenter. Stuvia facilitates payment to the seller.
Will I be stuck with a subscription?
No, you only buy these notes for $9.99. You're not tied to anything after your purchase.