Samenvatting
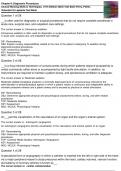
Summary Displays of Quantitative Data (Types of Graphs) A* notes for A-Level Psychology - VISUALLY PRESENTED, EVERYTHING YOU NEED TO KNOW FOR AN A*
- Vak
- Instelling
This is the AO1 (content) you need to know about displays of quantitative data (types of graphs). I am a visual learner so I made every sub-topic across the entire A-Level visually presented on a page - each page looking different. This meant that it was much easier to remember the content in the e...
[Meer zien]