100% satisfaction guarantee Immediately available after payment Both online and in PDF No strings attached
logo-home
WGU C207 Data Driven Decision Making Updated 2024/2025 Verified 100% $7.99   Add to cart

Exam (elaborations)

WGU C207 Data Driven Decision Making Updated 2024/2025 Verified 100%

 7 views  0 purchase
  • Course
  • WGU C207 Data Driven Decision Making
  • Institution
  • WGU C207 Data Driven Decision Making

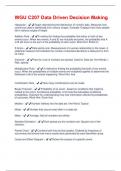
Histogram - ️️Graph representing the distribution of numeric data. Measures how continuous data is distributed over various ranges. Example: Displays how many people fall in various ranges of height. Addition Rule - ️️A method for finding the probability that either or both of two event...

[Show more]
Preview 2 out of 6  pages

  • September 17, 2024
  • 6
  • 2024/2025
  • Exam (elaborations)
  • Questions & answers
  • WGU C207 Data Driven Decision Making
  • WGU C207 Data Driven Decision Making
avatar-seller
ACADEMICMATERIALS
WGU C207 Data Driven Decision Making
Histogram - ✔️✔️Graph representing the distribution of numeric data. Measures how
continuous data is distributed over various ranges. Example: Displays how many people
fall in various ranges of height.

Addition Rule - ✔️✔️A method for finding the probability that either or both of two
events occur. When two events, A and B, are mutually exclusive, the probability that A
or B will occur is the sum of the probability of each event. Word Hint: Either/or.

Z-Score - ✔️✔️Data points only. Measurement of a scores relationship to the mean. A
statistical measure that indicates the number of standard deviations a data point is from
its mean.

Variance - ✔️✔️How far a set of numbers are spread. Used for Data set. Hint Words =
Risk, spread.

Multiplication Rule - ✔️✔️A method for finding the probability that both of two events
occur. When the probabilities of multiple events are multiplied together to determine the
likelihood of all of the events happening. Word Hint: And


Combination Rule - ✔️✔️How many combinations can be made.

Bayes Theorem - ✔️✔️Probability of an event , based on conditions that might be
related to the event. Conditional probability. A formula that calculates conditional
probabilities. Important for understanding how new information affects the probabilities
of outcomes. Word Hint: Given that.

Median - ✔️✔️Number halfway into the data set. Hint Word: Typical

Mode - ✔️✔️Number that occurs most often in a data set.

Mean - ✔️✔️Average. Add all numbers and divide.

Standard Deviation - ✔️✔️How spread out the numbers are. Square root of the
variance.

Pareto Chart - ✔️✔️Contains both line and bar graphs. Ordered by frequency of
occurrence that shows how many results were generated by each identified cause.

Cause and Effect Diagram - ✔️✔️Shows the causes of a specific event.

, Check Sheet - ✔️✔️Collect data in real time.

Control Chart - ✔️✔️Determines whether a process should undergo a formal exam for
quality.


Scatter Diagram - ✔️✔️A graphic that uses dots to show relationships or correlations
between variables

Flow/Run Chart - ✔️✔️Shows the workflow process

Bar Chart - ✔️✔️Graph of schedule-related info. Example: Measures how many people
are from each state.


Dependent Variable - ✔️✔️Dependent upon the Independent variable

Independent Variable - ✔️✔️Variable the drives the dependent variable

Range - ✔️✔️Difference between the lowest and highest number in a data set.
Example: 4,6,9,3,7 Range = 9-3 =6

T-Statistic - ✔️✔️Statistic (derived from a sample) used in hypothesis testing.
Determines if 2 sample means are significantly different from each other.

Central Limit Theorem - ✔️✔️Distribution of average of a large number of independent,
identical, variables will be approximately normal. OR the idea that if a large enough
number of samples is taken, the means of those samples will be normally distributed
around the population mean.

F-Statistic - ✔️✔️Value you get when you run an ANOVA test or a regression analysis
to find out if the means between two populations are significantly different.

ANOVA - ✔️✔️(Analysis of Variance) - Collection of statistical models used to analyze
the differences among group means, (Three or more groups) Compares samples over
different times. Uses same software as regression, but takes multiple sets of data and
tries to find the difference between the groups. At least three groups of data and sees if
there is any statistical value. Used to determine if there is a significant difference among
three or more means.

Linear Regression - ✔️✔️Describes data and explains the relationship between one
dependent variable and one more independent variables. Predictive analysis. Linear
relationship between two variables can be measured by its strength

The benefits of buying summaries with Stuvia:

Guaranteed quality through customer reviews

Guaranteed quality through customer reviews

Stuvia customers have reviewed more than 700,000 summaries. This how you know that you are buying the best documents.

Quick and easy check-out

Quick and easy check-out

You can quickly pay through credit card or Stuvia-credit for the summaries. There is no membership needed.

Focus on what matters

Focus on what matters

Your fellow students write the study notes themselves, which is why the documents are always reliable and up-to-date. This ensures you quickly get to the core!

Frequently asked questions

What do I get when I buy this document?

You get a PDF, available immediately after your purchase. The purchased document is accessible anytime, anywhere and indefinitely through your profile.

Satisfaction guarantee: how does it work?

Our satisfaction guarantee ensures that you always find a study document that suits you well. You fill out a form, and our customer service team takes care of the rest.

Who am I buying these notes from?

Stuvia is a marketplace, so you are not buying this document from us, but from seller ACADEMICMATERIALS. Stuvia facilitates payment to the seller.

Will I be stuck with a subscription?

No, you only buy these notes for $7.99. You're not tied to anything after your purchase.

Can Stuvia be trusted?

4.6 stars on Google & Trustpilot (+1000 reviews)

82215 documents were sold in the last 30 days

Founded in 2010, the go-to place to buy study notes for 14 years now

Start selling
$7.99
  • (0)
  Add to cart