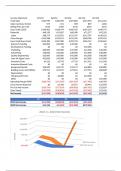
Income Statement Q1'21A Q2'21A Q3'21A Q4'21A Q1'22A
Total Sales $340,990 $360,490 $397,860 $455,950 $611,225
Sales Inventory [Units] 559 611 698 829 1,063
Selling Price per Unit $610 $590 $570 $550 $575
(Less Total COGS) $146,402 $168,479 $185,435 $187,164 $240,773
Materials $48,130 $52,607 $60,098 $71,377 $92,250
Labor $98,273 $115,872 $125,337 $115,787 $148,523
Gross Margin $194,588 $192,011 $212,425 $268,786 $370,452
(Less Total Base Costs) $223,383 $267,980 $293,732 $326,767 $333,669
Research Funding $25,000 $30,000 $35,000 $0 $0
Development Funding $0 $0 $0 $45,000 $0
Marketing $30,000 $33,000 $37,000 $41,000 $46,000
Advertising $18,000 $23,000 $28,000 $31,000 $28,000
Quality Engineering $25,000 $30,000 $45,000 $42,000 $40,000
Lean Six Sigma Costs $32,000 $32,000 $32,000 $25,000 $25,000
Inventory Costs $4,232 $5,793 $7,719 $11,931 $11,958
Inventory Rework Costs $0 $0 $0 $0 $0
Equipment Rental $18,200 $33,172 $33,172 $40,883 $40,883
Building Lease and Utilities $70,951 $75,015 $75,841 $79,953 $86,828
Depreciation $0 $0 $0 $0 $0
Hiring/Layoff Costs $0 $6,000 $0 $10,000 $0
Other $0 $0 $0 $0 $55,000
Operating Margin (OM) ($28,796) ($75,969) ($81,307) ($57,981) $36,783
(Less Interest Expense) $0 $1,700 $5,557 $8,942 $13,950
Pre-Tax Net Income ($28,796) ($77,669) ($86,863) ($66,923) $22,833
(Less Taxes) ($14,398) ($38,834) ($43,432) ($33,462) $11,416
Net Income ($14,398) ($38,834) ($43,432) ($33,462) $11,416
Q1 Q2 Q3 Q4
2021 Net Income ($14,398) ($38,834) ($43,432) ($33,462)
2022 Net Income $11,416 ($6,265) ($76,280) $179,546
2021 vs. 2022 Net Income
$200,000
$150,000
$100,000
US Dollar
$50,000
$0
Q1 2022 Net Income
Q2
($50,000) Q3 2021 Net Income
Q4
($100,000)
, US
$0
Q1 2022 Net Income
Q2
($50,000) Q3 2021 Net Income
Q4
($100,000)
Q1 Q2 Q3 Q4
2021 Gross Margin $194,588 $192,011 $212,425 $268,786
2022 Gross Margin $370,452 $436,894 $700,607 $952,539
2021 vs. 2022 Gross Margin
$1,000,000
$900,000
$800,000
$700,000
$600,000
US Dollar
$500,000
$400,000
$300,000
$200,000
$100,000
$0
2022 Gross Margin
Q1
Q2 2021 Gross Margin
Q3
Q4
,Q2'22A Q3'22A Q4'22A
$723,925 $1,145,400 $1,529,880
1,259 1,992 2,684
$575 $575 $570
$287,031 $444,793 $577,341
$109,782 $173,949 $231,851
$177,249 $270,843 $345,491
$436,894 $700,607 $952,539
$436,064 $837,104 $577,262
$0 $50,000 $0
$0 $295,000 $0
$21,000 $65,000 $95,000
$20,000 $65,000 $50,000
$20,000 $55,000 $65,000
$20,000 $60,000 $30,000
$19,158 $14,661 $2,525
$0 $0 $9,600
$83,679 $119,342 $155,006
$101,727 $91,601 $116,523
$0 $12,500 $12,500
$16,000 $4,000 $26,000
$134,500 $5,000 $15,109
$831 ($136,497) $375,276
$13,361 $16,062 $16,185
($12,530) ($152,559) $359,092
($6,265) ($76,280) $179,546
($6,265) ($76,280) $179,546
Q1 Q2 Q3 Q4
2021 Sales Inventory [Units] 559 611 698 829
2022 Sales Inventory [Units] 1,063 1,259 1,992 2,684
2021 vs. 2022 Unit Sales
3,000
2,500
2,000
Units
1,500
1,000
500
-
Q1 Q2 Q3 Q4
, 1,000
500
-
Q1 Q2 Q3 Q4


