100% satisfaction guarantee Immediately available after payment Both online and in PDF No strings attached
logo-home
Frequent Statistics Summary - Introductory Statistics with Randomization and Simulation (SOW-BKI138) $7.10   Add to cart

Summary

Frequent Statistics Summary - Introductory Statistics with Randomization and Simulation (SOW-BKI138)

 6 views  0 purchase
  • Course
  • Institution

Summary of Frequent Statistics (SOW-BKI138) course material, based on book "Introductory Statistics with Randomization and Simulation" by OpenIntro. This course is part of the AI bachelor curriculum, taught by Radboud University.

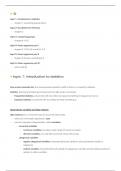
Preview 2 out of 15  pages

  • September 23, 2024
  • 15
  • 2023/2024
  • Summary
avatar-seller
●☆
topic 1: introduction to statistics
– chapter 1, excluding special topics

topic 2: foundation for inference
– chapter 2

topic 3: comparing groups
– chapter 4.1-4.3

topic 4: linear regression part I
– chapter 2.1-2.4, 2.6.6 and 5.1-5.3

topic 5: linear regression part II
– chapter 5.4 and 6, excluding 6.4

topic 6: linear regression part III
– extra material


● topic 1: introduction to statistics

inter-ocular traumatic test, the measurements speak for itself so there is no need for statistics

statistics, learning and drawing conclusions from data under uncertainty
– frequentist statistics, concerned with how often we expect something to happen by chance
– bayesian statistics, concerned with how likely we think something is


observations, variables and data matrices

data matrices are a convenient way to record and store data
– each row in the table represents a case
– columns represent characteristics, called variables
– numerical variables
– continous variables, can take a wide range of numerical values
– discrete variables, can only take numerical values with jumps
– categorical variables
– regular categorical variables, characterized by the ability to only qualitatively classify or
categorize
– ordinal variables, characterized by the ability to categorize a variable and its relative position in
relation to other variables

, overview of data collection principles

the target population is every case of the group that is being studied

a sample represents a subset of the cases and is often a small fraction of the population
– it is essential to draw a representative sample, and avoid bias
– simple random sample, the most basic random sample is called a
– convenience sample, sample where individuals who are easily accessible are more likely to be included

if we suspect a certain variable affects another variable, that variable is called to explanatory variable; the
variable that we suspect to be affected by the explanatory variable is called the response variable
– however, association does not imply causation

there are two primary types of data collection
– observational studies, when data is collected by the researchers in a way that does not directly interfere
with how the data arise
– experiments, when researchers want to investigate the possibility of a causal connection

sampling biases
– non-response, occurs if only a small fraction of a randomly sampled people actually respond to the
survey
– convenience sampling, sample where individuals who are easily accessible are more likely to be
included

experiments

in experimental research, the participants are divided between a treatment group and a control group

randomization and replication reduce bias and uncertainty
– randomization is done to account for variables that cannot be controlled
– replication is done to accurately estimate the effect of the explanetory variable on the response; in a
single study, we replicate by collecting a sufficiently large sample

blinding, when researchers keep the patients uninformed about their treatment to prevent psychological
effects


examining numerical data

a scatterplot provides case-by-case view of data for two numerical variables
– a dot plot is a one-variable scatterplot; the mean is a common way to measure the center of a
distribution of data

a histogram is a figure where the datapoints are collected into “bins” and plotted as bars, they are convenient
for describing the shape of the data distribution
– right-skewed shape, when data trails of to the right with a long tail
– left-skewed shape, data with a long, thin tail to the left

The benefits of buying summaries with Stuvia:

Guaranteed quality through customer reviews

Guaranteed quality through customer reviews

Stuvia customers have reviewed more than 700,000 summaries. This how you know that you are buying the best documents.

Quick and easy check-out

Quick and easy check-out

You can quickly pay through credit card or Stuvia-credit for the summaries. There is no membership needed.

Focus on what matters

Focus on what matters

Your fellow students write the study notes themselves, which is why the documents are always reliable and up-to-date. This ensures you quickly get to the core!

Frequently asked questions

What do I get when I buy this document?

You get a PDF, available immediately after your purchase. The purchased document is accessible anytime, anywhere and indefinitely through your profile.

Satisfaction guarantee: how does it work?

Our satisfaction guarantee ensures that you always find a study document that suits you well. You fill out a form, and our customer service team takes care of the rest.

Who am I buying these notes from?

Stuvia is a marketplace, so you are not buying this document from us, but from seller biba1. Stuvia facilitates payment to the seller.

Will I be stuck with a subscription?

No, you only buy these notes for $7.10. You're not tied to anything after your purchase.

Can Stuvia be trusted?

4.6 stars on Google & Trustpilot (+1000 reviews)

66579 documents were sold in the last 30 days

Founded in 2010, the go-to place to buy study notes for 14 years now

Start selling
$7.10
  • (0)
  Add to cart