100% satisfaction guarantee Immediately available after payment Both online and in PDF No strings attached
logo-home
Summary Molecular epidemiology of infectious diseases UA_2048FBDBMW_2324 $23.07   Add to cart

Summary

Summary Molecular epidemiology of infectious diseases UA_2048FBDBMW_2324

 7 views  0 purchase
  • Course
  • Institution

This document is a comprehensive summary of the course "Molecular Epidemiology of Infectious Diseases" by Prof. Jean-Claude Dujardin (). It includes detailed notes, PowerPoint slides, and corrected exercises from the lectures. Additionally, it contains a selection of exam questions, offering a thor...

[Show more]
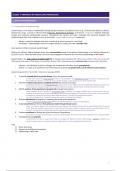
Preview 4 out of 67  pages

  • September 24, 2024
  • 67
  • 2023/2024
  • Summary
avatar-seller
fa


Chapter 1: PRINCIPLES OF MOLECULAR EPIDEMIOLOGY


1. WHAT IS EPIDEMIOLOGY?

1.1. Introduction to epidemiology
Epidemiology is the study of relationships existing between diseases and (a)biotic factors (e.g., environmental (biotic or abiotic),
behavioural, social, ..) prone to influence their Frequency, Distribution & Evolution. It forms the “integration” between molecular
biology and traditional epidemiologic research. Characterised by richness and major challenges like molecular biologists and
epidemiologists often have a different vision of the reality, “myopia” and “presbyopia” respectively.

⇨ Myopia = molecular biologist: look close at reality (e.g., what is present in a test tube)
⇨ Presbyopia = epidemiologist: look from a higher distance at reality, thus take a broader view !

Exam question: What is molecular epidemiology?

Waiting for sufficient hybrids between those two, communication needs to be optimal. Epidemiology of an infectious disease is a
dynamic feature. Travel and trade routes can cause easy propagation of diseases over the world. Epidemiology is NOT static !

Epidemiology is the basic science of public health (5). It answers basic questions like: What causes disease? How does it spread?
What prevents diseases? What works in controlling a disease? Mol. epidemiology uses molecular tools to answer these questions.

⇨ Infection = all individuals in which a pathogen has installed, but will often remain asymptomatic
⇨ Disease = in some cases of infection you’ll have diseases by becoming symptomatic, not all infections lead to disease

Epidemiology what for? (sl 14-20) + Take home messages (THM)

1. To provide scientific basis to prevent disease, injury and promote health
a. A study which shows the rapid evolution of HIV in a single patient. This phylogenetic analysis is made on the sequence of the
HIV at different moments. It shows the virus is rapidly evolving = many variants due to quick mutation rate
2. Determine relative importance to establish priorities for research and action
a. Establishing priorities by risk mapping/locating Leishanis cases in Iran. Different periods of 2009-2013 had places of higher risk
of Leishmaniasis changing through time. A control problem can target a specific region, knowing the parasite is moving
3. Identify sections of the population at greatest risk to target interventions
a. Using molecular tools to identify the transmission chain (tracking). If a subject is infected with a certain variant, then you
would like to know where this patient got infected. You use molecular biology to identify the variants found in the environment.
Also typical in nosocomial infections to know what the source is. This allows for targeted intervention.
b. E.g., green pathogen lives in swamp, so target the swamp to eradicate the pathogen
4. Evaluate effectiveness of programs in improving the health of the population
a. Example: massive drug administration (MDA) to accelerate elimination of drug resistant Malaria
5. Study natural history of disease from precursor states through clinical course
a. Study in a village in Nepal on the natural history of Leishmania. They sampled humans with VL and evaluated where they were
living. They also analysed animals living in proximity of the human subjects to analyse whether the animals play a role as
reservoir. They found many PCR positive animals, suggesting transmission between humans and animals
6. Conduct surveillance of disease and injury occurrence in populations
a. One of the most important applications of molecular epidemiology. This has been also demonstrated with the spread of COVID
7. Investigate disease outbreaks
a. To determine the origin by using several tools to investigate the disease outbreak. Epidemiology is dynamic, pathogens can
travel via human ways e.g., by plane, by car, etc. Global spread is easier compared to decenia’s ago.

THM
1) Never work alone
2) Always look at different perspectives
3) Epidemiology is NOT static


1

,1.2. Key epidemiological concepts & possible bottlenecks


Graph: purple lines are subjects that are followed going through a certain infection
⇨ Horizontal lines: individuals with certain disease course (short or long)
⇨ Vertical line: prevalent cases = 10 (new cases at a certain point in time)
○ PR (rate) = 10/ size of population studies (expressed per 100.000 pop)
○ STATIC concept !
⇨ Box: incident cases = 7 (new cases arising in a certain time period)
○ IR (rate) = 7 / size of population studies (expressed per year per 100.000 pop)
○ DYNAMIC concept !
CAUTION ! Often you only know the n° of notified cases in a year. This can be underreported so you’ve to be careful because the
incidence is always just estimated. You can only guess what the proportion of detected and notified incident cases is.


Sensitivity and specificity can be used to characterise the features of a diagnostic test (ROC analysis for quality control of the test).
The predictive value is the probability of those tested who are correctly classified.

Example: determine the sensitivity and specificity of a certain PCR for COVID-19. The cases are the people who have the disease or
infection, and the non-cases do not have the infection or disease.

⇨ Sensitivity: TP/TP+FN = 140/(140+60) = 140/200 = 0,70 or 70%
⇨ Specificity: TN/TN+FP = 19000/(19000+1000) = 19000/20000 = 0,95 or 95%
⇨ PPV: TP/TP+FP = 140/(140+1000) = 140/1140 = 12,3% (poor value)
⇨ NPV: TN/TN+FN = 19000/(19000+60) = 99.7%

* PPV: positive predictive value, NPV: negative predicted value

The table shows the relationship between the PPV and prevalence. You see that at
low prevalence of the disease the PPV is 1.4%. At high prevalence the PPV is 93.3%.
This concept shows that a given test can have a rather good PPV when the prevalence
is high and when nearly everyone is sick but once the prevalence decreases, such as
in a control program, the PPV will decrease → change to a different diagnostic test !

Example: Chagas was highly prevalent some decades ago. Now there is a control program causing low infection rates. This means
the diagnostic tests are not good anymore in terms of PPV. Better tests need to be used now.


When the prevalence decreases, the PPV is low. Then we can increase the sensitivity or
specificity. The higher the specificity, the higher the PPV. However, increasing
sensitivity will NOT have the same effect on PPV. Thus, if the prevalence is lower, you
need a diagnostic test with a higher specificity ! In the later case, it is better to use
another test (other specificity, sensitivity settings → see change conditions)


2

,The PPV of a particular test can also be improved by Appropriate Selection Strategy (ASS)
1. Testing of “high risk” groups (subjects with clinical signs rather than normal subjects)
2. Use a higher cutt-off with higher specificity OR use a 2nd test with a higher specificity
3. Use of multiple tests for interpretation of results

Exam question(s): Understand and apply basic epidemiological concepts (incidence, prevalence, sensitivity, specificity, predictive
value…)

1.3. Importance of a good study design
You have different types of studies:

⇨ Intervention trials (experimental): randomised controlled, intervention vs placebo → compare incidence of both groups
⇨ Cohort studies (observational): used to study incidence, causes, prognosis, etc (2 groups over time comparing outcomes).
They measure events in chronological order → used to distinguish bt cause & effect e.g. smokers vs non-smokers
⇨ Case-control studies (observational): compare groups retrospectively. They seek to identify possible predictions (biotic
or abiotic) of outcome and are useful for studying rare outcomes (e.g., diseases).
⇨ Cross-sectional studies (observational): used to determine prevalence. They’re relatively quick and easy but don’t permit
distinction between cause and effect.
○ Data collected at one point in time on one sample (possible to compare groups within sample)

Exam question: Understand the importance of study design & possible biases.

1.4. Sample size

The sample size is often under-evaluated in molecular epidemiological studies, which can cause an insufficient power to draw
conclusions. For example, if you want to design a PCR that is positive then there is drug resistance, and negative when there is not.
If there is a marker present in 100% of the drug-resistant cases, we would only need a sample size of 9 subjects (6/3) to get a
sufficient power for validation on the marker. However, in reality a marker of 100% is very rare. If the marker is present in 70% of
the resistant cases, but also present in 30% of the sensitive cases, you already need a sample size of 63 subjects.

1.5. Bottlenecks
Confounders

Suppose there is a statistical relationship between ice-cream consumption & n° of drowning deaths for a given period. These two
variables have a positive correlation with each other. An evaluator might attempt to explain this correlation by inferring a causal
relationship between two variables (either that ice-cream causes drowning, or that drowning causes ice-cream consumption).
However, a more likely explanation is that the relationship between ice-cream consumption and drowning is false and that a 3th
confounding variable (season-related) influences both variables: during the summer, warmer T lead to an increased ice-cream
consumption as well as more people swimming and thus more drowning deaths.

Design your study well to avoid confounders. We can control confounding by study design if we can, make the exposed and
unexposed groups similar in context of all disease determinants, through matching or randomising assignment of exposure, …

Correlation

Describes an association between variables: when one variable changes, so does the other? If so, in which direction? It is a
statistical indicator of the relationship between variables. If these variables change together, they covary. But this covariation is
not necessarily due to a direct or indirect causal link.

Causality

Means that changes in one variable brings changes in the other. There is a cause-and-effect relationship between variables. The
two variables are correlated with each other and there is also a causal link between them.

Information bias

Reality can be biassed at different levels. The cloud is reality, and it will be slightly modified by the brain, because of its structure to
give a certain perception (e.g., colour blindness). The bias can happen at plenty of places in the analysis.

There can be:
⇨ Noise in the analysis
⇨ After publication: peer-review to accept the paper
○ If a paper is accepted it doesn’t mean that it is the reality, it is just a reality → published paper ≠ holy Bible!
○ This can also change the perception of reality, thus be careful with the interpretation!

3

, 2. KEY GENETIC CONCEPTS

2.1. Population genetics (Mettler & Gregg, 1969)

Population is a spatiotemporal grouping of conspecific organisms. As a starting point in most theoretical approaches, populations
are treated like an ideal gas in physics. According to this analogy, individuals move about randomly and have equal access to all
other individuals as potential mates. More realistically, however, populations are structured in space.


Mating occurs at random within subpopulations, but barriers between subpopulations e.g., rivers, … restrict access to mates.
2.2. Phylogenetics (species definition)

Linnean species: group of individuals organisms that are capable of interbreeding to produce fertile offspring in nature

Bacteria: each species must have unique phenotypic properties and exhibit more than 70% DNA hybridisation among strains

Phylogenetic criterion of species: irreducible groups whose members are descended from a common ancestor and who all possess
a combination of certain defining, or derived, traits. Phylogenetic analysis can allow groups of individuals with the same origin.

Species?


Clonal theory
This theory has caused a lot of debate in the world of parasitology and was formulated by M. Tibayrenc. In cloncal reproduction you get a photocopy
of the same genome that is made (until a mutation occurs), with asexual reproduction. In sexual reproduction there is no strict reproduction: by the
combination of two genomes you get a new combination of genes which can cause for instance new phenotypes (innovation!)

⇨ The theory states that in natural populations of many pathogen species, recombination is not frequent enough to break
the pattern of preponderant colonial evolution. It does not refer to any precise cytological mechanism, but rather to the
genetic consequences of clonality. Hence, it includes selfing and homogamy.
⇨ Example (see figures below): As a scientist, it is important to know if the organism you’re working with has a sexual or
asexual reproduction. Here you look for markers of drug resistance. Let’s say R is a mutation in the gene directly
responsible for drug resistance. Z is a mutation in another gene, not responsible for DR, but which you have a marker for.
○ If clonal reproduction: detecting Z always predicts the presence of R (phenotype, DR) = indirect marker !
○ If recombination: detecting Z will not predict the presence of R (replaced by S) → in need of another marker !
⇨ Conclusion: the clonal theory forms an answer to the problem of species definition among pathogens. It is (medically)
important to know if a given pathogen produces clonally or not because:
○ Search for markers of phenotypic feature (resistance, virulence): direct vs indirect
○ Molecular epidemiology: if you’ve clonality, you’ve the
possibility to detect widespread stable genotypes
○ Vaccines & drug design


R=
resistance; S = sensitive
Phylogenetics
⇨ Character-based methods: for each locus you analyse the difference between the organisms to build a tree
⇨ Distance-based methods: you compare the proportion of loci that are the same between sequences to build a tree


4

The benefits of buying summaries with Stuvia:

Guaranteed quality through customer reviews

Guaranteed quality through customer reviews

Stuvia customers have reviewed more than 700,000 summaries. This how you know that you are buying the best documents.

Quick and easy check-out

Quick and easy check-out

You can quickly pay through credit card or Stuvia-credit for the summaries. There is no membership needed.

Focus on what matters

Focus on what matters

Your fellow students write the study notes themselves, which is why the documents are always reliable and up-to-date. This ensures you quickly get to the core!

Frequently asked questions

What do I get when I buy this document?

You get a PDF, available immediately after your purchase. The purchased document is accessible anytime, anywhere and indefinitely through your profile.

Satisfaction guarantee: how does it work?

Our satisfaction guarantee ensures that you always find a study document that suits you well. You fill out a form, and our customer service team takes care of the rest.

Who am I buying these notes from?

Stuvia is a marketplace, so you are not buying this document from us, but from seller yevvacranshoff. Stuvia facilitates payment to the seller.

Will I be stuck with a subscription?

No, you only buy these notes for $23.07. You're not tied to anything after your purchase.

Can Stuvia be trusted?

4.6 stars on Google & Trustpilot (+1000 reviews)

84866 documents were sold in the last 30 days

Founded in 2010, the go-to place to buy study notes for 14 years now

Start selling
$23.07
  • (0)
  Add to cart