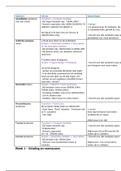
SPSS uitwerkingen van het vak Psychometrie dat wordt gegeven op de Universiteit Leiden. Per week staat schematisch uitgelegd welke stappen je in SPSS moet doen. Heel handig om bij de toets van SPSS te houden! Ik heb hiermee een 9 gehaald.
Opdracht Uitvoer Opmerkingen
Gemiddelde uitrekenen Transform → Compute Variabele.
voor een schaal - Bij Target Variabele: bijv. ‘’MEAN.LOKm’’.
- Numeric expression: bijv. MEAN.5(LOKMO1 TO > Let op!
LOKMO7, LOKMO9 TO LOKMO11) .5 is gebaseerd op 10 variabelen. Als j
12 variabelen hebt, gebruik je .6 etc.
Nu krijg je in de data view een nieuwe rij
(MEAN.LOKm) erbij. > Doe dit voor alle variabelen waar je
gemiddelde voor moet berekenen.
Grafische weergave • Maak eerst tabel van de statistieken:
tonen Analyze → Descriptive Statistics → Descriptives
for the descriptive statistics.
- Bij Variables: bijv. MEAN.LOKm en MEAN.LOKf
- Bij Options: mean, std. deviation, minimum,
maximum.
• Grafiek maken (histogram):
Graphs → Legacy Dialogs → Histogram > Doe dit voor alle variabelen waar je
een histogram voor moet maken.
Let op bij histogram:
- Sprake van unimodae distributie (één piek)?
- Is de distributie asymmetrisch (de verdeling
loopt aan één zijde van de piek langer uit)?
- Sprake van een negatieve scheefheid (staart
naar links / rechts)?
Normtabel maken Analyze → Reports → Case Summaries.
- Bij Variabele: norm scores (ZMEAN.LOKm,
TMEAN.LOKm, PMEAN.LOKm)
- Grouping variables: scare score (MEAN.LOKm)
- Zet uit: display cases
- Statistics: alleen mean in rechter kolom > Doe dit voor alle variabelen apart.
Percentielscores Transform → Rank Cases.
berekenen Bij Variabele: MEAN.LOKm en MEAN.LOKf
- Rank Types: ‘’Rank’’ uitzetten; ‘’Fractional rank > Let op!
as %’’ aanzetten Deze stap herhaal je voor iedere
- Ties: High variabele die ze vragen.
Altijd tussen 0 en 100.
T-scores berekenen Transform → Compute Variabele.
- Bij Target Variabele: bijv. > Doe dit voor alle variabelen apart.
‘’TMEAN.LOKm’’
- Numeric expression: Altijd tussen 20 en 80 (rond de 50),
50 + 10 * ZMEAN.LOKm. anders zijn er uitbijters.
Z-scores berekenen Analyze → Descriptive Statistics → Descriptives. > Doe dit voor alle variabelen apart.
- Bij Variables: bijv. MEAN.LOKm
- Vink aan: Save standardized values as Altijd tussen -3 en 3 (rond de 0),
variables. anders zijn er uitbijters.
Week 1 – Schaling en normscores
The benefits of buying summaries with Stuvia:
Guaranteed quality through customer reviews
Stuvia customers have reviewed more than 700,000 summaries. This how you know that you are buying the best documents.
Quick and easy check-out
You can quickly pay through credit card or Stuvia-credit for the summaries. There is no membership needed.
Focus on what matters
Your fellow students write the study notes themselves, which is why the documents are always reliable and up-to-date. This ensures you quickly get to the core!
Frequently asked questions
What do I get when I buy this document?
You get a PDF, available immediately after your purchase. The purchased document is accessible anytime, anywhere and indefinitely through your profile.
Satisfaction guarantee: how does it work?
Our satisfaction guarantee ensures that you always find a study document that suits you well. You fill out a form, and our customer service team takes care of the rest.
Who am I buying these notes from?
Stuvia is a marketplace, so you are not buying this document from us, but from seller samenvatting551. Stuvia facilitates payment to the seller.
Will I be stuck with a subscription?
No, you only buy these notes for $5.83. You're not tied to anything after your purchase.