100% satisfaction guarantee Immediately available after payment Both online and in PDF No strings attached
logo-home
Summary All lectures + Examples DABS $6.96
Add to cart

Summary

Summary All lectures + Examples DABS

 37 views  2 purchases
  • Course
  • Institution

Notes from all the lectures examples of the course Design and Analysis of Biomedical Studies (DABS) at Leiden University. Covers linear regression, logistic regression, mixed models, ANOVA, meta-analysis, interim analysis, survival analysis, reliability. Also about study designs, bias, confoundin...

[Show more]

Preview 4 out of 59  pages

  • January 15, 2020
  • 59
  • 2019/2020
  • Summary
avatar-seller
Lectures DABS
LT Brush up Methoden en Technieken
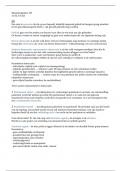
1. Determinant or exposure
2. Outcome
3. Domain (study population)
4. Time/period

Measure disease frequency
Prevalence: Total number of cases at a certain moment in time
Incidence: Number of new cases per a certain period
Incidence proportion/risk
Incidence rate


Example:
The risk is 1/5
The incidence rate is 1/4,5 because the
person time is 4,5 years. A diseased person
only counts until it gets diseased.

Important to mention the …-years risk
because the risk can be different over a
certain period.

Question:
In the US soldiers are screened every 2 years on antibodies against HIV. This happened for
the first time in 1988. Among 15000 soldiers 30 persons tested positive. Two years later in
1990, the same group of soldiers was screened. From those who were positive in 1988, 6
persons had died. The total number of positive tests was 84 in 1990.

a) Prevalence of having antibodies in 1988: 30/15000 = 0,2%

b) What is the incidence rate over the two year period?:
15000-30= 14970 subjects left

,84 tested positive, but of this only 60 new cases (30 already positive, but 6 of these died so
84-30+6.

Person years: 14970 * 2 = 29940. But need -60 because you do not know when the got
diseased, so they count for only 1 year. This comes to 29880 person years. However, for
such large numbers and low case numbers the -60 is not necessary.

Incidence rate is then 60/29940 person-years → 2/1000 person-years.
Incidence rate per 1000 person years.

c) Mortality risk for those who tested positive over a period of two years: 6/30=20%

Prevalence; Number of existing cases / total population. Important for planning of care and
policy. Gives you no information about new cases.

Incidence risk: Number of new cases over a time period/ total population at risk followed over
that time period

Incidence rate: Number of new cases / total time followed. Make use of population data.

Epidemiological studies
Diagnosis - Cross-sectional study
Prognosis - Follow up/cohort study
Etiology - Cohort/case-control study
Therapy - Randomized controlled trial (RCT)

Cohort/follow-up study: Study population with subjects exposed and non-exposed. Follow
during time. Count the number of disease or the outcome. For association between exposure
and occurrence of disease.

Case-control studies: Selection of patients with the disease, the cases. Ask about their
exposure. Compare their history of exposure with that of control persons without the disease
(exposure odds ratio). For the association between exposure and disease.

Randomized controlled trial: Is an experiment with randomization of treatment and placebo.
For effect and safety of an intervention.

Measure of effect
Absolute risk: Number of cases / number of persons
Risk difference: Risk exposed - Risk unexposed
Number needed to treat : NNT = 1/RD → 1 / the risk difference
Number of patients that need to be treated to prevent one disease/death

Relative risk
Risk ratio: risk exposed / risk unexposed
Rate ratio: incidence rate exposed / incidence rate unexposed

,Odds ratio: (a/c)/(b/d)
Example: In a case-control study on the association between oral contraceptives
and rheumatoid arthritis (RA), 94 patients our of 138 patients with RA had used oral
contraceptives. Out of 378 control subjects, 323 had used oral contraceptives.

RA + RA -
OC + 94 323 417
OC - 44 55 99
138 378
So: (94/44)/(323/55) = 0,36
Odd ratio below 1 suggest something that is protective. Would mean that if you use oral
contraceptives you have a lower risk of rheumatoid arthritis. However, bias because
rheumatoid arthritis patients probably will use less oral contraceptives.

Statistics
Variables can be:
Numerical - Can be summarized by the mean (SD), median (SD) or quantiles.
Ordinal; when the order matters
Nominal; when the order does not matter - Can be summarized by the count (%)
Binary; either one of two, yes or no

Outliers do not change the median, but they do change the mean. Median is insensitive to
outliers. Median is the center of the data, the 50% quantile. Interquartile range is the Q75 or
Q25. Gives you information about the spread of the data. Alternative for SD which is
insensitive to outliers.
Uncertainty about the mean can be quantified by the standard error (SE). Standard error is
the standard deviation divided by the square root of the number of measurements. Standard
deviation is the spread/distribution of the data you measured. However, the SE tells you
something about the range in which the mean will fall if you where to repeat the experiment.
About the certainty of the mean. SE is the standard deviation of the mean. SE is
dependent on the sample size. The higher the sample size, the lower the SE.
Confidence interval for the mean can be used to determine whether the null-hypothesis
needs to be reconsidered. Need a mean and the standard error. Confidence interval is the
mean +- 1,96SE. Only for sample sizes larger than 30. Alpha level of 5% gives a confidence
level of 95%.
Unpaired t-test: Compare the mean of two independent groups
The P-value is the chance to observe the data itself or an even extremer data set under the
assumption that the null hypothesis is true. Interpretation is how extreme our data is. The P-
value is a conclusion about the data. Does it fit into the null hypothesis? The P-value is no
conclusion about the null hypothesis. Power is the chance to reject the null hypothesis when
it is not true.

PPV and NPV
PPV = Chance when positively tested you actually have the disease
NPV = Chance when negatively tested you actually do not have the disease
Sensitivity = Chance when you have the disease the test will be positive
Specificity = Chance when you do not have the disease the test will be negative

, 𝑠𝑒𝑛𝑠𝑖𝑡𝑖𝑣𝑖𝑡𝑦∗𝑝𝑟𝑒𝑣𝑎𝑙𝑒𝑛𝑐𝑒
PPV =
(𝑠𝑒𝑛𝑠𝑖𝑡𝑖𝑣𝑖𝑡𝑦∗𝑝𝑟𝑒𝑣𝑎𝑙𝑒𝑛𝑐𝑒)+(1−𝑠𝑝𝑒𝑐𝑖𝑓𝑖𝑐𝑖𝑡𝑦)∗(1−𝑝𝑟𝑒𝑣𝑎𝑙𝑒𝑛𝑐𝑒)
𝑠𝑝𝑒𝑐𝑖𝑓𝑖𝑡𝑖𝑡𝑦∗(1−𝑝𝑟𝑒𝑣𝑎𝑙𝑒𝑛𝑐𝑒)
NPV =
(𝑠𝑝𝑒𝑐𝑖𝑓𝑖𝑡𝑖𝑡𝑦∗(1−𝑝𝑟𝑒𝑣𝑎𝑙𝑒𝑛𝑐𝑒))+(1−𝑠𝑒𝑛𝑠𝑖𝑡𝑖𝑣𝑖𝑡𝑦)∗𝑝𝑟𝑒𝑣𝑎𝑙𝑒𝑛𝑐𝑒


Confidence interval
Standard deviation of the mean (the SE) is smaller than the standard deviation of the
individual measurements. SE = σ/√n → It is √n times as small. So the higher the sample size,
the smaller the SE will be.
The confidence interval depends on the alpha level. Most of the time alpha will be 0.05, so
then there will be a 95% CI with the mean being ± 1.96 SE.

Types of tests


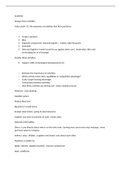
LT Deep vein thrombosis and factor V Leiden
Meta-analysis of observational studies to compare the outcome of different studies on the
same subject. Can then pool the studies and calculate the pooled results.
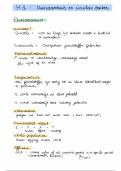
Causal pies (Rothman) for multi-causality. Risks have a cumulative contribution and one
small thing can then lead to ‘de druppel die de emmer doet overlopen’. If the pie completely
fills, you get the diseases.
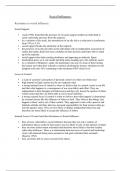
Randomized controlled trial: Use a patient group and then randomize this group. One group
will receive placebo, the other anticoagulation. After some time determine in both groups the
recurrence% and bleeding%. Also need to take side-effects into consideration.

The benefits of buying summaries with Stuvia:

Guaranteed quality through customer reviews

Guaranteed quality through customer reviews

Stuvia customers have reviewed more than 700,000 summaries. This how you know that you are buying the best documents.

Quick and easy check-out

Quick and easy check-out

You can quickly pay through credit card or Stuvia-credit for the summaries. There is no membership needed.

Focus on what matters

Focus on what matters

Your fellow students write the study notes themselves, which is why the documents are always reliable and up-to-date. This ensures you quickly get to the core!

Frequently asked questions

What do I get when I buy this document?

You get a PDF, available immediately after your purchase. The purchased document is accessible anytime, anywhere and indefinitely through your profile.

Satisfaction guarantee: how does it work?

Our satisfaction guarantee ensures that you always find a study document that suits you well. You fill out a form, and our customer service team takes care of the rest.

Who am I buying these notes from?

Stuvia is a marketplace, so you are not buying this document from us, but from seller lottebambacht. Stuvia facilitates payment to the seller.

Will I be stuck with a subscription?

No, you only buy these notes for $6.96. You're not tied to anything after your purchase.

Can Stuvia be trusted?

4.6 stars on Google & Trustpilot (+1000 reviews)

53068 documents were sold in the last 30 days

Founded in 2010, the go-to place to buy study notes for 14 years now

Start selling
$6.96  2x  sold
  • (0)
Add to cart
Added