Unit 2- Practical Scientific Procedures and Techniques
Summary
Summary Unit 2B applied science level 3 foundation diploma distinction level
0 purchase
Course
Unit 2- Practical Scientific Procedures and Techniques
Institution
PEARSON (PEARSON)
Unit 2 of the Level 3 Applied Science Foundation Diploma features four comprehensive assignments that delve into essential scientific principles across biology, chemistry, and physics. These assignments provide an in-depth understanding of theoretical concepts through practical experiments, equippi...
Unit 2- Practical Scientific Procedures and Techniques
All documents for this subject (370)
Seller
Follow
JamesMoore147
Reviews received
Content preview
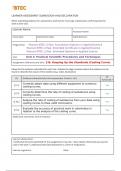
LEARNER ASSESSMENT SUBMISSION AND DECLARATION
When submitting evidence for assessment, each learner must sign a declaration confirming that the
work is their own.
Learner Name:
Assessor Name:
Issue date: Submission date: Submitted on:
Programme: Pearson BTEC L3 Nat. Foundation Diploma in Applied Science
Pearson BTEC L3 Nat. Extended Certifi cate in Applied Science
Pearson BTEC L3 Nat. Extended Diploma in Applied Science
Unit: Unit 2: Practical Scientific Procedures and Techniques
Assignment reference and title: 2.B: Keeping Up the Standards (Cooling Curve)
Please list the evidence submitted for each task. Indicate the page numbers where the evidence can be
found or describe the nature of the evidence (e.g. video, illustration).
AC
AC Evidence submitted (for the Assessment Criteria - AC)
Achieved ?
Correctly obtain data using different equipment to construct
B.P3 Yes
cooling curves.
Correctly determine the rate of cooling of substances using
B.P4 Yes
cooling curves.
Analyse the rate of cooling of substances from your data using
B.M2 Yes
cooling curves to draw valid conclusions.
Evaluate the accuracy of practical work in calorimetry in
B.D2 Yes
relation to the analysis of the cooling curve.
Additional comments to the Assessor:
Learner declaration:
I certify that the work submitted for this assignment is my own. I have clearly referenced any sources
used in the work. I understand that false declaration is a form of malpractice.
Learner signature: Date:
,BTEC Assignment Brief (NQF)
Pearson BTEC L3 Nat. Foundation Diploma in Applied Science
Qualification Pearson BTEC L3 Nat. Extended Certificate in Applied Science
Pearson BTEC L3 Nat. Extended Diploma in Applied Science
Unit number and title Unit 2:
Practical Scientific Procedures and Techniques
Learning aim(s) (For NQF
only)
B: Undertake Calorimetry to Study Cooling Curves.
Assignment title 2.B: Keeping Up the Standards
Assessor
Issue date
Hand in deadline
You are a newly appointed technical assistant at a large chemical
plant, Chemcalequip. As part of your induction period and to
progress in your role, you have to demonstrate skills in a range of
practical procedures and techniques. Part of your role is to ensure
equipment is calibrated and equipment and chemicals are safety
Vocational Scenario or checked.
Context You need to demonstrate your ability to use a calorimeter and
associated equipment to obtain data to determine, analyse and
evaluate the rate of cooling of substances. You will need to
present evidence of your practical skills analysis and evaluation in
a report.
Task 1 Produce a report to evaluate the accuracy of your practical
work in calorimetry.
Ensure you have checked the calibration of a digital and liquid
thermometer before use. Draw conclusions about any
thermometer that may not be properly calibrated.
You will need to demonstrate that you can correctly:
Select appropriate equipment and set it up.
Use the equipment safely to heat the solid substance(s) to
above the melting point, measure temperature, at
appropriate intervals as it cools and record the data in a
table of your own design.
Use the data to construct cooling curves for two substances
(stearic acid and paraffin wax.)
When planning your data collection, you may wish to consider the
following factors:
o amount of substance used (mass/volume)
o how cooling will occur (in air, water)
, o surface area of the container(s)
o type of thermometer
o lid/no lid
Use the graphs you have constructed to accurately determine the
rate of cooling near the start and demonstrate the ability to draw
a tangent to the curve and find its gradient. Draw valid
conclusions about the rate of cooling near the start, end and
where the rate appears to have changed dramatically in between.
Evaluate the accuracy of your practical work in relation to the
analysis of the cooling curves and the equipment and methods
you used. This should include
a description of the patterns and trends seen
a comparison of your results to published data and class
values.
an analysis of how the rate of cooling is related to
intermolecular forces and the state of the substances.
an explanation of why it may be necessary to make
changes to procedures in order to reduce levels of
uncertainty.
Checklist of evidence A report, evaluating the accuracy of the cooling curve experiment
required to include:
A set of results from checking the calibration of thermometers.
A table of time/temperature data and graphs of temperature
against time for two substances cooling.
Calculations and analysis of the rate of cooling at points on the
graphs.
An observation report of the investigation including calibration of
thermometers completed by the tutor.
Criteria covered by this task:
Unit/Criteria
To achieve the criteria you must show that you are able to:
reference
Evaluate the accuracy of practical work in calorimetry in relation to the
B.D2
analysis of the cooling curve.
Analyse the rate of cooling of substances from your data using cooling curves
B.M2
to draw valid conclusions.
B.P3 Correctly obtain data using different equipment to construct cooling curves.
B.P4 Correctly determine the rate of cooling of substances using cooling curves.
Sources of information http://www.chemteam.info/Thermochem/Determine-Specific-
to support you with Heat.html
this Assignment
http://www.virtlab.com/main.aspx
Stuvia customers have reviewed more than 700,000 summaries. This how you know that you are buying the best documents.
Quick and easy check-out
You can quickly pay through credit card or Stuvia-credit for the summaries. There is no membership needed.
Focus on what matters
Your fellow students write the study notes themselves, which is why the documents are always reliable and up-to-date. This ensures you quickly get to the core!
Frequently asked questions
What do I get when I buy this document?
You get a PDF, available immediately after your purchase. The purchased document is accessible anytime, anywhere and indefinitely through your profile.
Satisfaction guarantee: how does it work?
Our satisfaction guarantee ensures that you always find a study document that suits you well. You fill out a form, and our customer service team takes care of the rest.
Who am I buying these notes from?
Stuvia is a marketplace, so you are not buying this document from us, but from seller JamesMoore147. Stuvia facilitates payment to the seller.
Will I be stuck with a subscription?
No, you only buy these notes for $5.70. You're not tied to anything after your purchase.