Real Estate Finance and Urban Development (6013B0558Y)
All documents for this subject (1)
Seller
Follow
sietsevandam
Content preview
Summary – Real Estate Finance and Urban Development
The Markets for Real Estate Assets and Space: A Conceptual Framework – Denise
DiPasquale and William C. Wheaton
The market for real estate is comprised of two inter-related markets, the market for real estate
space and the market for real estate assets. In the space or property market, rents are paid by its
users. In the asset market, assets are sold between owners. In purchasing a home, the annual
payments that a household can afford are determined primarily by its level of income. Conditions in
the capital market, however, determine how a household converts these annual payments into a
purchase price. If interest rates are low and inflation high, families will be willing to offer higher
prices even though their annual ability to pay is unchanged.
U.S. real estate is the largest component of national wealth, and the largest component of annual
net private investment. This huge base of assets, however, has been accumulated by devoting only
about 5%-7% of each year's GDP to the construction and renovation of that base. It is, of course, the
durability of real estate that allows us to devote such a small fraction of GDP to the accumulation
and maintenance of such a large share of our assets.
The new supply of real estate assets depends on the price of those assets relative to the cost of
replacing or constructing them. In the long run, the asset market should equate market prices with
replacement costs. In the short run, however, the two may diverge significantly because of the lags
and delays that are inherent in the construction process. For example, if demand for the ownership
of space suddenly rises, then with a fixed supply of assets, prices will rise as well. With prices now
above construction costs, new construction takes place. As this space arrives on the market, demand
is satisfied and prices begin to fall back towards the cost of replacement.
For firms, space is one of many factors of production, and like any other factor, its use will depend
on firm output levels and the relative cost of space. The household demand for space depends on
income and the cost of occupying that space relative to the cost of consuming other commodities.
The task of the property market is to determine a rent level at which the demand for space equals
the supply of space. All else equal, when the number of households increases or firms expand
production, the demand for space use rises. With fixed supply, rents rise as well.
The link between the markets for assets and property occurs at two junctions. First, the rent levels
determined in the property market are central in determining the demand for real assets. After all,
in acquiring an asset, the investors are really purchasing a current or future income stream. Thus,
changes in rent occurring in the property market immediately affect the demand for assets in the
capital market. The second link between the two markets occurs through the construction sector. If
construction increases and the supply of assets grows, not only are prices driven down in the asset
market, but rents decline in the property market as well.
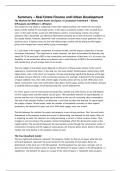
The Four-Quadrant model
The two right-hand quadrants represent the property market for the use of space, while the two
left-hand quadrants represent the asset market for the ownership of real estate. Rents are
determined in the short run in the NE quadrant. The NE quadrant has two axes: rent (per unit of
space) and the stock of space (units of space). The demand for space is drawn in the NE quadrant. In
equilibrium, the demand for space, D, is equal to the stock of space, S. Taking the stock as given,
, rent, R. must be determined so that demand is exactly equal to the stock. Demand is a function of
rent and conditions in the economy: 𝐷 (𝑅, 𝐸𝑐𝑜𝑛𝑜𝑚𝑦) = 𝑆.
The NW quadrant represents the first part of the asset
market and has two axes: rent and price. The ray emanating
out of the origin represents the capitalization rate for real
estate assets: the ratio of rent to price. The purpose of the
NW quadrant is to take the rent level, R, from the NE
quadrant and determine a price for real estate assets, P,
𝑅
using a capitalization rate, i. 𝑃 = . A higher capitalization
𝑖
rate is represented by a clockwise rotation in the ray, while a
decline in the cap rate is represented by a counter-clockwise
rotation. In this quadrant, the capitalization rate is taken as
exogenous, based on interest rates and returns in the
broader capital market for all assets.
The SW quadrant is that portion of the asset market where
the construction of new assets is determined. The curve,
𝑓(𝐶), represents the replacement cost, CCosts, of real estate. The cost of construction is assumed to
increase with greater building activity, and therefore the curve moves in a southwesterly direction. It
intersects the price axis at that minimum dollar value required to get some level of construction
under way. Given the price of real estate assets from the NW quadrant, a line down to the
replacement cost curve and then over to the vertical axis determines the level of new construction
where replacement costs equal asset prices. Lower levels of construction would lead to excess
profits while higher levels would be unprofitable. Hence, asset price, P, is equal to construction
costs, CCosts, both of which are a function of construction level, C: 𝑃 = 𝐶𝐶𝑜𝑠𝑡𝑠 = 𝑓(𝐶).
In the final SE quadrant, the annual flow of new construction is converted into a long-run stock of
real estate space. The change in stock, ∆𝑆, in a given period is equal to new construction minus
losses from the stock measured by the depreciation rate, d: ∆𝑆 = 𝐶 − 𝑑𝑆.
In summary, starting with a stock of space, the property
market determines rents which then get translated into
property prices by the asset market. These asset prices, in
turn, generate new construction that, back in the property
market, eventually yields a new level of stock. The combined
property and asset markets are in equilibrium when the
starting and ending levels of the stock are the same.
The Four-Quadrant model: a shock in demand for space
The demand curve in the NE quadrant shifts outwards. For a
given level of real estate space, rents must therefore rise.
These higher rents then lead to greater asset prices in the
NW quadrant which, in turn, generate a higher level of new
construction in the SW quadrant. Eventually this leads to a
greater stock of space (SE quadrant). In the new equilibrium, neither rents, prices, construction, nor
the stock can be less than in the initial equilibrium. The magnitude of the changes in these variables
depends on the slopes of the various curves.
The benefits of buying summaries with Stuvia:
Guaranteed quality through customer reviews
Stuvia customers have reviewed more than 700,000 summaries. This how you know that you are buying the best documents.
Quick and easy check-out
You can quickly pay through credit card or Stuvia-credit for the summaries. There is no membership needed.
Focus on what matters
Your fellow students write the study notes themselves, which is why the documents are always reliable and up-to-date. This ensures you quickly get to the core!
Frequently asked questions
What do I get when I buy this document?
You get a PDF, available immediately after your purchase. The purchased document is accessible anytime, anywhere and indefinitely through your profile.
Satisfaction guarantee: how does it work?
Our satisfaction guarantee ensures that you always find a study document that suits you well. You fill out a form, and our customer service team takes care of the rest.
Who am I buying these notes from?
Stuvia is a marketplace, so you are not buying this document from us, but from seller sietsevandam. Stuvia facilitates payment to the seller.
Will I be stuck with a subscription?
No, you only buy these notes for $7.94. You're not tied to anything after your purchase.