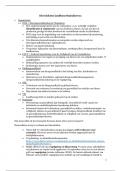
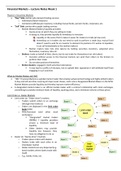
This is an extended summary of all lectures for the course Multivariate Statistics (1ZM31). This 22-page document (with a clickable table of contents for easier navigation) summarizes the essence of all topics covered in the course (as far as I could imagine when writing it). It includes as many im...
Table of contents
Data exploration
Multivariate dataset
Metric vs non-metric measurement
Nonmetric data
Metric data
Data visualization
Boxplot
Scatterplot
Multivariate outliers
Mahalanobis Distance (MD)
Checking for normality
Missing data
Missing Completely At Random (MCAR)
Missing At Random (MAR)
Not Missing At Random (NMAR)
Exploratory Factor Analysis (EFA)
The factor model
Finding the right factor model
The number of factors
Factor loadings
Factor rotation
Factor reliability
Factor validity
Reporting of EFA
The regression model
Ordinary Least Squares (OLS)
Assumptions in linear regression
Linearity (assumption 1)
Model comparison
Normally distributed error term (assumption 2)
Homoskedasticity (assumption 3)
Exogeneity (assumption 4)
Multicollinearity (no assumption)
Interesting cases
An explanatory variable is non-metric
1ZM31 - course summary 1
, An explanatory variable is the output of a factor analysis
The effect of one variable depends on another variable
The logit model
Linear Probability Model
The logit model
Including another dummy variable
Maximum Likelihood
Logit model fit
Akaike Information Criterion (AIC)
HIT rate
Sources of uncertainty
More about interpretation
Structural Equation Modeling (SEM)
Data exploration
Multivariate dataset
→ several variables are measured for each unit of analysis.
q variables
n units of analysis
Fits in a rectangle
Rows/columns can be shuffled
Columns/variables can be shuffled
An example of a multivariate dataset.
Metric vs non-metric measurement
Types of data.
Nonmetric data Metric data
1ZM31 - course summary 2
, Nominal scales → no ordering Interval scales → no meaningful absolute zero
Dummy variable (0/1) e.g. temperature → 10°C is not twice as
warm as 5°C
e.g. EU citizen: yes/no
Ratio scales → meaningful absolute zero
Categorical variable
e.g. height of a person
e.g. gender: nonbinary/female/male
e.g. the number of employees
e.g. transportation: bike/foot/car
Ordinal scales → ordering
e.g. education: high school/bachelor/PhD
Data visualization
→ to get a feel for the data.
What is measured?
What are “normal” values?
How much variation is there in the data?
Are there groups in the data?
Boxplot
Example of a boxplot.
Scatterplot
1ZM31 - course summary 3
The benefits of buying summaries with Stuvia:
Guaranteed quality through customer reviews
Stuvia customers have reviewed more than 700,000 summaries. This how you know that you are buying the best documents.
Quick and easy check-out
You can quickly pay through credit card or Stuvia-credit for the summaries. There is no membership needed.
Focus on what matters
Your fellow students write the study notes themselves, which is why the documents are always reliable and up-to-date. This ensures you quickly get to the core!
Frequently asked questions
What do I get when I buy this document?
You get a PDF, available immediately after your purchase. The purchased document is accessible anytime, anywhere and indefinitely through your profile.
Satisfaction guarantee: how does it work?
Our satisfaction guarantee ensures that you always find a study document that suits you well. You fill out a form, and our customer service team takes care of the rest.
Who am I buying these notes from?
Stuvia is a marketplace, so you are not buying this document from us, but from seller im2123. Stuvia facilitates payment to the seller.
Will I be stuck with a subscription?
No, you only buy these notes for $8.07. You're not tied to anything after your purchase.