In this document, I provide a concise overview of the first three weeks, highlighting key points and initial insights. The following sections, covering weeks 4 to 6, are more detailed, as these weeks presented the most challenging content. I have thoroughly discussed these topics to clarify the com...
Financial Data Decision Analysis (E_FIN_FDDA)
All documents for this subject (1)
Seller
Follow
danielhuijgen
Content preview
Summary FDDA
Finance: financial management 2024
Week 1, 2 and 3 (the basics)
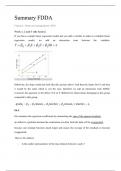
If you have a simple linear regression model and you add a variable to make it a multiple linear
regression model, we add an interaction term between the variables.
Otherwise, the slope would just look like this, picture above! And then the slopes for b1 and beta
2 would be the same which is not the case, therefore we add an interaction term B3XD.
it answers the question: is the effect of X on Y different for observations belonging to this group
compared to that group.
OLS
Ols estimates the regression coefficients by minimizing the sum of the squared residuals.
an outlier is a problem because the conclusions we draw from the data will be exaggerated.
because one residual becomes much larger and causes the average of the residuals to become
exaggerated.
How to fix outliers:
- Is the outlier representative of the true relation between x and y?
, - Is the outlier explained by factors unrelated to the relation between x and y?
- Does including the outlier lead to false conclusions about the relation between x and y.
R2 = coefficient of determination = variance of fitted values of y divided by the values of y itself
Fitted values means the expected values of y.
R squared does not tell anything about how good a model is. Because the interpretation of the r
squared depends on the context.
Even the best model in the world for predicting stock returns will have a very low R value.
Important:
SE is the standard error of B1.
SE of b1 tells us how much variation or dispersion is there in the b1(^) estimates. How precisely
does b1(^) estimate the value of B1?
IF B1 – u is close to zero then the t statistic will be low. Otherwise, it will be large. (very positive
or negative)
,Even a small difference between an estimate and the null hypothesis will be remarkable, then a
small standard error will cause you to make you reject the null hypothesis. More data is always
better.
And it also works the other way. A large SE then even a large difference between b1hat and mu
does not give you the right to reject null hypothesis.
You need to balance type 1 and 2 errors!
NOTE: when we cannot reject the null hypothesis it does not mean that we accept the null
hypothesis. We don’t know that it is true, but we cannot reject the possibility that it is true!
One final note: the P value:
P value = the probability of obtaining a t statistic that is equal to or more extreme than the one that
was obtained, under the condition that the null hypothesis was true.
So, for example: you find a t statistic of 2.33 and a p value of 0.02 then if the null hypothesis is
true then the probability of finding a t statistic greater or equal to 2.33 is 0.02.
What do we learn:
, T = beta_estimate – value of 0 hypothesis / SE (beta_estimate)
Classes*teacher: meaning it is statistically significant at the 5% level. We compare t statistic, or we
look at p value.
The effect of class attendance is significantly positive for good and bad teachers, and the effect is
significantly more positive for good teachers because the interaction term is positive. Teacher
quality by itself it is not significant, so we cannot reject the null hypothesis. What we see here is
that the effect that teacher quality has on grades happens trough class attendance and not by itself.
Finaly, we notice a low r2 but still a lot of significant effects.
Statistical significance is not economic significant!
Something that is statistically significant is statistically important, but not always important in the
real world.
Students often talk about something that is significant, but it is also relevant. Is it economically
significant? Are this large effects?
Think about the previous example of good and bad teachers and classes:
The effect is large. By attending four classes you can increase your expected grade by 1 point.
The benefits of buying summaries with Stuvia:
Guaranteed quality through customer reviews
Stuvia customers have reviewed more than 700,000 summaries. This how you know that you are buying the best documents.
Quick and easy check-out
You can quickly pay through credit card or Stuvia-credit for the summaries. There is no membership needed.
Focus on what matters
Your fellow students write the study notes themselves, which is why the documents are always reliable and up-to-date. This ensures you quickly get to the core!
Frequently asked questions
What do I get when I buy this document?
You get a PDF, available immediately after your purchase. The purchased document is accessible anytime, anywhere and indefinitely through your profile.
Satisfaction guarantee: how does it work?
Our satisfaction guarantee ensures that you always find a study document that suits you well. You fill out a form, and our customer service team takes care of the rest.
Who am I buying these notes from?
Stuvia is a marketplace, so you are not buying this document from us, but from seller danielhuijgen. Stuvia facilitates payment to the seller.
Will I be stuck with a subscription?
No, you only buy these notes for $9.57. You're not tied to anything after your purchase.