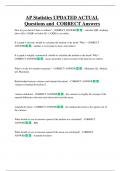
AP Statistics UPDATED ACTUAL Questions and CORRECT Answers
0 view 0 purchase
Course
AP Statistics
Institution
AP Statistics
AP Statistics UPDATED ACTUAL
Questions and CORRECT Answers
How do you check if there is outliers? - CORRECT ANSWER - calculate IQR; anything
above Q3+1.5(IQR) or below Q1-1.5(IQR) is an outlier
If a graph is skewed, should we calculate the median or the mean? Why? - CORRECT
ANSWER - median;...
AP Statistics UPDATED ACTUAL
Questions and CORRECT Answers
How do you check if there is outliers? - CORRECT ANSWER - calculate IQR; anything
above Q3+1.5(IQR) or below Q1-1.5(IQR) is an outlier
If a graph is skewed, should we calculate the median or the mean? Why? - CORRECT
ANSWER - median; it is resistant to skews and outliers
If a graph is roughly symmetrical, should we calculate the median or the mean? Why? -
CORRECT ANSWER - mean; generally is more accurate if the data has no outliers
What is in the five number summary? - CORRECT ANSWER - Minimum, Q1, Median,
Q3, Maximum
Relationship between variance and standard deviation? - CORRECT ANSWER -
variance=(standard deviation)^2
variance definition - CORRECT ANSWER - the variance is roughly the average of the
squared differences between each observation and the mean
standard deviation - CORRECT ANSWER - the standard deviation is the square root of
the variance
What should we use to measure spread if the median was calculated? - CORRECT
ANSWER - IQR
What should we use to measure spread if the mean was calculated? - CORRECT
ANSWER - standard deviation
,What is the IQR? How much of the data does it represent? - CORRECT ANSWER - Q3-
Q1; 50%
How do you calculate standard deviation? - CORRECT ANSWER - 1. Type data into L1
2. Find mean with 1 Variable Stats
3. Turn L2 into (L1-mean)
4. Turn L3 into (L2)^2
5. Go to 2nd STAT over to MATH, select sum(
6. Type in L3
7. multiply it by (1/n-1)
8. Square root it
What is the formula for standard deviation? - CORRECT ANSWER -
Categorical variables vs. Quantitative Variables - CORRECT ANSWER - Categorical:
individuals can be assigned to one of several groups or categories
Quantitative: takes numberical values
If a possible outlier is on the fence, is it an outlier? - CORRECT ANSWER - No
Things to include when describing a distribution - CORRECT ANSWER - Center (Mean
or Median), Unusual Gaps or Outliers, Spread (Standard Deviation or IQR), Shape (Roughly
Symmetric, slightly/heavily skewed left or right, bimodal, range)
Explain how to standardize a variable. What is the purpose of standardizing a variable? -
CORRECT ANSWER - Subtract the distribution mean and then divide by standard
deviation. Tells us how many standard deviations from the mean an observation falls, and in
what direction.
, What effect does standardizing the values have on the distribution? - CORRECT
ANSWER - shape would be the same as the original distribution, the mean would become
0, the standard deviation would become 1
What is a density curve? - CORRECT ANSWER - a curve that (a) is on or above the
horizontal axis, and (b) has exactly an area of 1
Inverse Norm - CORRECT ANSWER - when you want to find the percentile: invNorm
(area, mean, standard deviation)
z - CORRECT ANSWER - (x-mean)/standard deviation
pth percentile - CORRECT ANSWER - the value with p percent observations less than is
cumulative relative frequency graph - CORRECT ANSWER - can be used to describe the
position of an individual within a distribution or to locate a specified percentile of the
distribution
How to find and interpret the correlation coefficient r for a scatterplot - CORRECT
ANSWER - STAT plot, scatter, L1 and L2 (Plot 1: ON); STAT --> CALC -->
8:LinReg(a+bx)
No r? --> 2nd 0 (Catalog) down to Diagnostic ON
r - CORRECT ANSWER - tells us the strength of a LINEAR association. -1 to 1. Not
resistant to outliers
r^2 - CORRECT ANSWER - the proportion (percent) of the variation in the values of y
that can be accounted for by the least squares regression line
The benefits of buying summaries with Stuvia:
Guaranteed quality through customer reviews
Stuvia customers have reviewed more than 700,000 summaries. This how you know that you are buying the best documents.
Quick and easy check-out
You can quickly pay through credit card or Stuvia-credit for the summaries. There is no membership needed.
Focus on what matters
Your fellow students write the study notes themselves, which is why the documents are always reliable and up-to-date. This ensures you quickly get to the core!
Frequently asked questions
What do I get when I buy this document?
You get a PDF, available immediately after your purchase. The purchased document is accessible anytime, anywhere and indefinitely through your profile.
Satisfaction guarantee: how does it work?
Our satisfaction guarantee ensures that you always find a study document that suits you well. You fill out a form, and our customer service team takes care of the rest.
Who am I buying these notes from?
Stuvia is a marketplace, so you are not buying this document from us, but from seller MGRADES. Stuvia facilitates payment to the seller.
Will I be stuck with a subscription?
No, you only buy these notes for $10.49. You're not tied to anything after your purchase.