100% satisfaction guarantee Immediately available after payment Both online and in PDF No strings attached
logo-home
Economics, Welfare & Distribution - Summary of all lectures - 2019/2020 $6.41
Add to cart

Summary

Economics, Welfare & Distribution - Summary of all lectures - 2019/2020

1 review
 1 purchase
  • Course
  • Institution
  • Book

Both detailed and compact summary of all 5 lectures by Marks and Castelein. Including the most important graphs and clear description of them. (If you can find the time, could you rate this? Thanks :D )

Last document update: 4 year ago

Preview 4 out of 26  pages

  • Unknown
  • February 25, 2020
  • July 8, 2020
  • 26
  • 2019/2020
  • Summary

1  review

review-writer-avatar

By: hristijanstevoski • 4 year ago

avatar-seller
ECONOMICS, WELFARE & DISTRIBUTION
Erasmus University Rotterdam
Summary of all 5 lectures


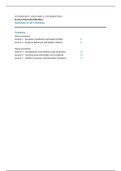
Contents
Micro-economics
Lecture 1 – Economic Vocabulary and Supply (Marks) 2
Lecture 2 – Producer Behaviour and Welfare (Marks) 5

Macro-economics
Lecture 3 – Introduction to the Welfare State (Castelein) 11
Lecture 4 – Social Security and Health Care (Castelein) 16
Lecture 5 – Welfare Economics and Education (Castelein) 21

, Summary based on the 2020 lecture by Peter Marks & Bob Castelein


Lecture 1 – Economic Vocabulary and Supply
Concepts
Economics The study of the allocation of scarce resources to meet unlimited human wants.
Micro Focused on the decision-making by individual economic agents such as firms and
consumers. There is a limited amount of resource while there is an unlimited want.
This leads to a limited use of resources (1 Litre of water can’t be used twice). Thus, it
is all about choices. People choose what brings the most utility or pleasure.
Macro Focused on the aggregate performance of the entire economic system. In macro-
economics the individual and her/his feelings are not important. And individual will
be taken on average. In this model there is an important assumption: human
behaviour is rational and consistent.
Consumer One who consumes a produced good or service, generally by financial purpose.
Firms Those that transform factors of production into goods and services to sell.
Governments Those that provide rules for how firms and consumers should interact.

Economics
Economic theory relies upon principles to analyse behaviour of economic agents. Economics
provides an objective mode of analysis with rigorous models that are predictive of human behaviour.
These models are built upon assumptions: simplifications of reality. Models can easily be made more
realistic or complex, they can explain about 90% of human behaviour.
3 simplifications:
 Ceterus paribus
“All other things equal”. This principle poses that only the variables in a model will change.
The context will be kept stable, unchanged and as simple as possible. This is a trade-off
between reality and usefulness. Ceterus paribus is useful for determining the effect of one
variable or concept.
 Marginal decision-making
Marginal = “one more”. It is not about how much an individual buys, it is about what the
next step will be. Every time someone buys a good over again, the utility or pleasure that
comes from this good will decrease. At the same time the costs will increase.
 Representative agents
“An economic decision-maker who can recognise that different factors influence and
motivate different economic groups”. There are 3 types: consumers, firms and governments.
A representative agent is the very average of an individual in an economic system. All
models are based on these average individuals or representative agents.

Scarcity and Welfare
Adam Smith (1776): “The things which have the greatest value in use have frequently little or no
value in exchange. On the contrary, those which have the greatest value in exchange, have
frequently little or no value in use.”  Water is essential but cheap, diamonds are useless but
extremely expensive.

The wants are different from the resources. The wants are unlimited, the resources are limited.
Therefore we say there is relative scarcity, which is why it is all about choices. In this model we
assume that representative agents behave rational:
1. Individuals are goal-oriented
2. Choices are consistent


2

, Summary based on the 2020 lecture by Peter Marks & Bob Castelein


 Completeness: a>b OR b>a OR a=b
People have preferences of certain goods over others.
 Transitivity: IF a>b AND s>a, THEN s>b
If one likes apples (a) better than bananas (b) and strawberries (s) better than apples, as
a result one likes strawberries better than bananas.
 Completeness and transitivity have no time element. Time is not an issue, today and
tomorrow one like apples better then bananas.
 Selfishness doesn’t limit rationality. Humans are still consistent in de ordering of the
preferences. At the same time the motives can be different: selfishness, selflessness,
wellbeing of others, dedication to society, etc.
 Adam Smith talks of an invisible hand: the market has self-regulating capacities.

Individual = Welfare. The degree of perceived satisfaction for which relatively scarce resources
utility are needed. This is subjective. Preferences are externally given and stable.
Marginal How much satisfaction a product or services brings a customer. This can both be
utility positive and negative (show with + or – sign). Additional consumption provides
smaller and smaller increases in utility. In the end it can (in theory) even be negative.
 Objective
 Income = money
 Wealth = amount of resources to satisfy needs
 Subjective
 Welfare = appreciation of the resources
 Wellbeing = appreciation that is independent of the allocation of scarce resources.

Efficient A firm is efficient when there is no waste and the amount of output is maximised.
An optimal relation between in- and output. “Doing the thing right”
Effective A firm is effective when there is a balance in output and the wants/desires.
Perfect Ideally a firm is both efficient and effective.

Demand and Supply
 Law of Demand: an inverse relationship exists between the price of the good and the amount of
that buyers are willing to purchase.
An increase in the price of a good will raise the opportunity cost of consuming it. For every
product or service there is a certain range in the price in which consumers are willing to buy it.
This aggregation leads to the law of demand. When the price is too high or too low, people will
either not be interested or everyone is interested, respectively.
 Law of Supply: a direct relationship exists between the price of
the good and the amount of it that will be offered for sale.
For every good or service there is a certain range in which the
provider thinks it is worth producing or providing the goods or
services. Some things will never be provided, however high the
price is. Often there is lower limit under which providers don’t
find it worth providing. These ranges depend on the context and
incentives.


3

, Summary based on the 2020 lecture by Peter Marks & Bob Castelein


In a graph both the demand and supply can be shown according to the quantity (q) on the x-axis and
price (p) on the y-axis. The intersection of the two curves is the equilibrium.
Demand and supply curves can shift (left and right) by external reasons.
Shifts in the demand curve:
 Taste and preference of consumers
 Number of consumers
 Income (money) of consumers
 Prices and availability of related/alternative goods
Shifts in the supply curve:
 Price of resources
 Technology changes
 Taxes and subsidies
 Prices of other goods
 Number of sellers

Stability
This graph is stable. Why?
When the price (p) increases  the demand quantity
decreases and the supply quantity increases  the demand
quantity is lower than the supply quantity  there is an
excess  the providers want to sell the excess so there will be
price competition  price will decrease again  back to
equilibrium.


This graph is unstable. Why?
When the price increases to p1  the demand quantity
decreases and the supply quantity decreases  the supply
quantity is lower than the demand quantity  there will be
an excess in the demand  the price will increase even more
 moving away from the equilibrium.


This graph is stable. Why?
When the price increases to p1  the demand quantity
decreases and the supply quantity increases  the demand
quantity is lower than the supply quantity  there is an
excess  the providers want to sell the excess so there will
be price competition  price will decrease again  back to
equilibrium.


4

The benefits of buying summaries with Stuvia:

Guaranteed quality through customer reviews

Guaranteed quality through customer reviews

Stuvia customers have reviewed more than 700,000 summaries. This how you know that you are buying the best documents.

Quick and easy check-out

Quick and easy check-out

You can quickly pay through credit card or Stuvia-credit for the summaries. There is no membership needed.

Focus on what matters

Focus on what matters

Your fellow students write the study notes themselves, which is why the documents are always reliable and up-to-date. This ensures you quickly get to the core!

Frequently asked questions

What do I get when I buy this document?

You get a PDF, available immediately after your purchase. The purchased document is accessible anytime, anywhere and indefinitely through your profile.

Satisfaction guarantee: how does it work?

Our satisfaction guarantee ensures that you always find a study document that suits you well. You fill out a form, and our customer service team takes care of the rest.

Who am I buying these notes from?

Stuvia is a marketplace, so you are not buying this document from us, but from seller IlonaPost. Stuvia facilitates payment to the seller.

Will I be stuck with a subscription?

No, you only buy these notes for $6.41. You're not tied to anything after your purchase.

Can Stuvia be trusted?

4.6 stars on Google & Trustpilot (+1000 reviews)

65507 documents were sold in the last 30 days

Founded in 2010, the go-to place to buy study notes for 15 years now

Start selling
$6.41  1x  sold
  • (1)
Add to cart
Added