100% satisfaction guarantee Immediately available after payment Both online and in PDF No strings attached
logo-home
Summary SPSS Manuel for TSB Premasters (MMS, MTO-C, Causal analysis) $3.24   Add to cart

Summary

Summary SPSS Manuel for TSB Premasters (MMS, MTO-C, Causal analysis)

1 review
 179 views  19 purchases
  • Course
  • Institution

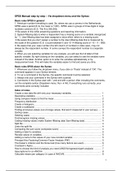
SPSS commands are described step by step through the dropdown menu and the Syntax. With this manual you can easily understand how to use SPSS commands an what this output means. All the mentioned commands are used in the courses: Mathematics, Measurements and Statistics (MMS), MTO-C, Causal Analysi...

[Show more]
Preview 2 out of 13  pages

  • March 2, 2020
  • 13
  • 2019/2020
  • Summary

1  review

review-writer-avatar

By: amberstorimans • 4 year ago

avatar-seller
SPSS Manual step by step – Via dropdown menu and the Syntax
Basic rules SPSS in general
1. American number formatting is used. So, where we use a comma in the Netherlands,
SPSS uses a period (E.G. the mean is 7.051). SPSS uses in groups of three digits in large
numbers comma’s (E.G. The N is 350,000).
 Be aware of this while answering questions and reporting information.
2. System-Missing data is when a respondent has a missing score on a variable (recognized
by “.”). User-Missing data has been assigned a value which refers to a missing score.
 Be aware that you don’t assign a number to the User-Missing data that is measured by
the scale of the question (E.G. a score between 0 and 10  Missing score of - / 999).
3. Be aware that your case number (the left column of numbers in data view), may not
always be the respondent number. In some surveys the respondent number is a separate
variable.
4. When you are selecting variables for any analysis, you will see the full label of that
specific variable. By right-clicking on the variables, you can select to see the variable name
instead of the label. Another option is to order the variables alphabetically or by
measurement level. This will make the variables easier to find and saves you time.
Basic rules SPSS about the Syntax
1. Whenever you follow the dropdown menu, if you click on “Paste” instead of “OK”. The
command appears in your Syntax window.
2. To run a command in the Syntax, the specific command must be selected.
3. Always end your command in the Syntax with a period.
4. Comments in the Syntax start with * and end with a period. After including the comments,
run the complete syntax (Dropdown menu: Run  All). If everything runs correctly, your
comments were correctly included.
Index of notes
Create a new data file with only your necessary variables…………………………………. 1
Descriptive statistics…………………………………………………………………………….. 1
Using compare means to find the mean………………………………………………………. 2
Frequency distribution…………………………………………………………………………... 2
Create a histogram………………………………………………………………………………. 3
Create a scatterplot……………………………………………………………………………… 3
Finding erroneous values (out-of-range values, that aren’t measured in your survey)….. 3
Sorting cases…………………………………………………………………………………….. 3
Deleting cases……………………………………………………………………………………. 3
Find/recognize missing values………………………………………………………………….. 3
Coding missing values (make System-Missing data User-Missing data)………………….. 4
Split file……………………………………………………………………………………………. 4
Undo the split file…………………………………………………………………………………. 4
Computing the sum score (composite score) ………………………………………………… 4
Adding a label to variables………………………………………………………………………. 5
Recode values of variables……………………………………………………………………… 5
Adding a name to the values of your new recoded variable………………………………… 5
Principal Axis Factoring/Common Factor Analysis (PAF) …………………………………… 5
The Kaiser’s criterion and the Scree test (how many factors are used)……………………. 6
Cronbach’s Alpha……………………………………………………………………………….... 7
How to choose the kind of analysis you need (ANOVA/regression/path analysis) ………. 7
Assumptions for an ANOVA………………………………………………………………….… 8
Calculate means per category (in case of ANOVA) ………………………………………… 8

1

, Checking the normal distribution of the Y-variable per group………………………………. 8
Perform an ANOVA-analysis……………………………………………………………………. 8
Perform a Levene’s test to test the Homogeneity of variances between groups………….. 8
Assumptions for a Pearson’s correlation……………………………………………………… 9
Performing a correlation……………………………………………………………………….... 9
Performing a correlation, and test if this effect differs between data-groups……………… 9
Creating dummy-variables…………………………………………………………………….... 10
Assumptions for bivariate regression………………………………………………………….. 10
Perform a bivariate OLS (“ordinary least squares”) regression analysis…………………… 10
Check if there is homoscedasticity or heteroscedasticity in your regression model………. 11
Predicted values, observed values and residuals (calculate residual)……………………… 12
Perform a sequential regression analysis……………………………………………………… 12
Test for multicollinearity………………………………………………………..………………… 13
Create a new data file with only your necessary variables
Dropdown menu
File  Save As  Variables  Drop all  Check the boxes of the variables you want to
keep in the column “Keep”  Continue  Change the name of the file, so the old file will not
be changed  Save  File  Open  Data  Select the name of your newly created
dataset  Open
Descriptive statistics
(N, mean, standard deviation, minimum, maximum, range, variance)
Dropdown menu
Analyze  Descriptive statistics  Descriptives  Select variable(s)  OK
Syntax
Type in the Syntax:
DESCRIPTIVES VARIABLES=VARIABLE NAME /STATISTICS=MEAN STDDEV MIN MAX
RANGE VARIANCE.
 Run (green triangle button)
! When you want to calculate the descriptives for multiple variables, just add the variable
names after the “VARIABLES=”. Keep in mind that you use the spacebar between the
variables
Using compare means to find the mean
(Instead of using descriptives, you can also find the mean through another way)
Dropdown menu
Analyze  Compare means  Means  Select variable  Paste into the “Dependent List”
 OK
Syntax
Type in the Syntax:
MEANS TABLES=VARIABLE NAME
/CELLS=MEAN COUNT STDDEV.
 Run
Frequency distribution
(Frequency, percent, valid percent, cumulative percent)
Dropdown menu
Analyze  Descriptive statistics  Frequencies  Select variable(s)  OK
Syntax
Type in the Syntax:


2

The benefits of buying summaries with Stuvia:

Guaranteed quality through customer reviews

Guaranteed quality through customer reviews

Stuvia customers have reviewed more than 700,000 summaries. This how you know that you are buying the best documents.

Quick and easy check-out

Quick and easy check-out

You can quickly pay through credit card or Stuvia-credit for the summaries. There is no membership needed.

Focus on what matters

Focus on what matters

Your fellow students write the study notes themselves, which is why the documents are always reliable and up-to-date. This ensures you quickly get to the core!

Frequently asked questions

What do I get when I buy this document?

You get a PDF, available immediately after your purchase. The purchased document is accessible anytime, anywhere and indefinitely through your profile.

Satisfaction guarantee: how does it work?

Our satisfaction guarantee ensures that you always find a study document that suits you well. You fill out a form, and our customer service team takes care of the rest.

Who am I buying these notes from?

Stuvia is a marketplace, so you are not buying this document from us, but from seller susanschoenmakers. Stuvia facilitates payment to the seller.

Will I be stuck with a subscription?

No, you only buy these notes for $3.24. You're not tied to anything after your purchase.

Can Stuvia be trusted?

4.6 stars on Google & Trustpilot (+1000 reviews)

67096 documents were sold in the last 30 days

Founded in 2010, the go-to place to buy study notes for 14 years now

Start selling
$3.24  19x  sold
  • (1)
  Add to cart