100% satisfaction guarantee Immediately available after payment Both online and in PDF No strings attached
logo-home
Final Exam Complete Exam Questions With Verified Guaranteed Answers. $13.49   Add to cart

Exam (elaborations)

Final Exam Complete Exam Questions With Verified Guaranteed Answers.

 0 view  0 purchase
  • Course
  • DOEN
  • Institution
  • DOEN

Enter a formula in the selected cell using AVERAGEIFS to calculate the average expense (use the named range Cost) where the value in the Category named range is equal to the text string "Computer Expense" and the value in the SubCategory named range is equal to the test string "Internet Access". - ...

[Show more]
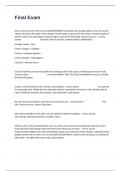
Preview 2 out of 9  pages

  • November 18, 2024
  • 9
  • 2024/2025
  • Exam (elaborations)
  • Questions & answers
  • DOEN
  • DOEN
avatar-seller
RealGrades
Final Exam

Enter a formula in the selected cell using AVERAGEIFS to calculate the average expense (use the named
range Cost) where the value in the Category named range is equal to the text string "Computer Expense"
and the value in the SubCategory named range is equal to the test string "Internet Access". - correct
answer Formulas, More Functions, Statistical Menu, AVERAGEIFS,

Average_Range = Cost

Criteria_Range1 = Category

Criteria = Computer Expense

Criteria_Range2 = SubCategory

Criteria2 = Internet Access


Use the Flash Fill command to autofill the remaining cells in this column with the pattern from cell F2. -
correct answer In the Data Ribbon Tab in the Data Tools Ribbon Group, you clicked
the Flash Fill button.


Create a new file based on the Inventory List template - correct answer You opened
the backstage view, clicked the New navigation button, searched for inventory in the Template Search
Input, clicked the Inventory list template, and clicked the Create button.


Run the Document Inspector and remove any issues found. - correct answer File,
Info, Check for Issues, Inspect Document


Add a linear trendline to this chart. Use the default trendline formatting. - correct answer
Chart design, Add Chart Element, Trendline, Linear.


Edit the code for the FormatPieChart macro to add a new comment in the blank line above the chart
style code that reads Change chart style Press Enter when you are done. - correct answer
In the Developer Ribbon Tab in the Code Ribbon Group, you clicked the Macros button. Inside the Macro
dialog from the Macro name: list, you selected FormatPieChart. Inside the Macro dialog, you clicked the
Edit button. You edited the macro code, pressed Enter

, Install the Solver add-in. - correct answer File, Options, Add-ins, click "Go", Check
"Solver add-ins".


Add this comment to cell B4: Why are printing costs so high? - correct answer
Review, new comment, type it.


Apply the Intense Effect SmartArt style to the diagram. It is the last option in the Best Match for
Document section of the gallery. - correct answer SmartArt Design, SmartArt Styles,
The fifth style.


Import data from the StudentGPA text file into a table in a new worksheet. - correct answer
On the Data tab, in the Get & Transform Data group, click the From Text/CSV button. In the Import Data
dialog, click StudentGPA, and click the Import button. Click the Load button.


Ungroup the grouped sheets. - correct answer You right clicked the Dec 2 tab. In the
Tab Right Click menu, you clicked the Ungroup Sheets menu item.


Save this file as a template that allows macros. - correct answer File, Save as, Click
down arrow next to "save" , Click "Excel Macro-Enabled Template (*.xltm), Save.


Group together the Dec 2 and Dec 9 worksheets - correct answer press and hold the
Shift key while clicking the Dec 9 tab.


Create a scenario summary report. Accept the recommended results cells. - correct answer
Data, What-if Analysis, Scenario Manager, Scenario Summary, Click "Ok".


The Anne Cole data point has been selected for you. Explore the Anne Cole data point by exactly 50% to
move it away from the rest of the pie chart. - correct answer Format, Format
Selection, Type "50%" in Point Explosion


Create a Forecast Sheet based on the selected data. Use a line chart and forecast values through 2021. -
correct answer Data, Forecast Sheet, Create

The benefits of buying summaries with Stuvia:

Guaranteed quality through customer reviews

Guaranteed quality through customer reviews

Stuvia customers have reviewed more than 700,000 summaries. This how you know that you are buying the best documents.

Quick and easy check-out

Quick and easy check-out

You can quickly pay through credit card or Stuvia-credit for the summaries. There is no membership needed.

Focus on what matters

Focus on what matters

Your fellow students write the study notes themselves, which is why the documents are always reliable and up-to-date. This ensures you quickly get to the core!

Frequently asked questions

What do I get when I buy this document?

You get a PDF, available immediately after your purchase. The purchased document is accessible anytime, anywhere and indefinitely through your profile.

Satisfaction guarantee: how does it work?

Our satisfaction guarantee ensures that you always find a study document that suits you well. You fill out a form, and our customer service team takes care of the rest.

Who am I buying these notes from?

Stuvia is a marketplace, so you are not buying this document from us, but from seller RealGrades. Stuvia facilitates payment to the seller.

Will I be stuck with a subscription?

No, you only buy these notes for $13.49. You're not tied to anything after your purchase.

Can Stuvia be trusted?

4.6 stars on Google & Trustpilot (+1000 reviews)

75323 documents were sold in the last 30 days

Founded in 2010, the go-to place to buy study notes for 14 years now

Start selling
$13.49
  • (0)
  Add to cart