BI Lab Summary
Rania El Ghalbzouri 1
IBT 3 2024-2025
, Table of Contents
Mindmaps ............................................................................................................... 3
Chart Analysis ......................................................................................................... 4
Storyboards ............................................................................................................. 5
Biases ..................................................................................................................... 6
Guest Lecture 1: Marketing Content .......................................................................... 7
Guest Lecture 1: Marketing KPI’s ............................................................................... 9
Guest Lecture 2: HR Content .................................................................................. 10
Guest Lecture 2: HR KPI’s ....................................................................................... 12
Guest Lecture 3: Supply Chain Content ................................................................... 13
Guest Lecture 3 : Supply Chain KPI’s ....................................................................... 16
Guest Lecture 4: Finance Content ........................................................................... 17
Guest Lecture 4: Finance KPI’s ................................................................................ 20
Book Summary ...................................................................................................... 21
Introduction ....................................................................................................... 21
Chapter 1: Driven by data, decisions, or preferences? ........................................... 22
Chapter 2: Decisions .......................................................................................... 24
Chapter 3: Questions .......................................................................................... 27
Chapter 4: Data .................................................................................................. 30
Chapter 5: Answers ............................................................................................ 33
Chapter 6: Data for a purpose .............................................................................. 36
Conclusion: A New Division of Labor .................................................................... 40
Rania El Ghalbzouri 2
IBT 3 2024-2025
, Mindmaps
What is a mindmap
A mind map is a visual tool that organizes information around a central idea, branching
out into related topics and subtopics. It uses keywords, images, and colours to simplify
complex ideas, enhance memory, and support brainstorming, planning, and problem-
solving. Mindmaps offer a number of benefits such as:
➢ Enhanced Creativity and Idea Generation: Visually linking concepts sparks
innovative thinking.
➢ Improved Memory: Mirrors the brain's natural structure, aiding in retention through
visual cues.
➢ Better Organization of Thoughts: Breaks down and arranges ideas logically.
➢ Simplifies Complex Information: Makes challenging topics clear and digestible.
➢ Encourages Focus: Requires attention to detail and active engagement.
➢ Facilitates Problem-Solving: Provides a comprehensive view of challenges to
identify effective
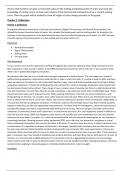
How to make a mindmap
➢ Start with the Main Topic: Place the central idea in
the middle of the page.
➢ Add Branches and Sub-branches: Extend
branches outward from the central idea for related
topics and break them into smaller detail s.
➢ Use Colors and Images: Add visual elements to
make the map engaging and easier to remember.
➢ Connect Related Ideas: Draw lines or arrows to
link related branches or concepts.
➢ Use Keywords and Short Phrases: Keep the
content concise to ensure clarity and focus
Example of a “good” mindmap
Rania El Ghalbzouri 3
IBT 3 2024-2025
, Chart Analysis
The seven steps to interpret a chart
➢ Understand the Title: The title provides the main topic
or purpose of the chart.
➢ Examine the Axes: Identify what the x-axis and y-axis
represent to understand the variables being compared.
➢ Analyze the Chart: Look at the data points, lines, bars,
or other elements to grasp the overall structure.
➢ Look for Trends: Identify patterns, such as increases,
decreases, or consistent behaviour.
➢ Spot Deviations: Note any outliers, sharp changes, or
irregularities.
➢ Ask Questions: Consider what the chart tells you and
what further questions it raises.
➢ Imagine a Story: Use the insights to form a narrative that explains the data and its
implications.
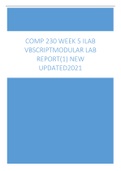
Example
➢ Understand the Title: "America is Carrying the G7,"
➢ Examine the Axes: While there are no traditional
axes, I would say the Y-axis would list the countries
and X-axis would display the percentages in GDP
Share.
➢ Analyse the Chart: The chart highlights the
economic dominance of the US within the G7.
➢ Look for Trends: The chart reflects an increasing
trend in the US's economic dominance. It is noted
that the US's share of G7 GDP has risen by 10
percentage points since 1980.
➢ Spot Deviations: The United States is a clear
outlier, contributing a far larger share of GDP
compared to other G7 countries.
➢ Ask Questions: What are the effects of this
economic imbalance within the G7?
What factors have driven the US's rise in economic
dominance?
➢ Imagine a Story: This chart tells the story of the US as the economic leader of the G7.
Its dominance may lead to greater influence over the group's policies and
negotiations, while also raising concerns about economic disparities and their
potential impact on global cooperation and stability.
Rania El Ghalbzouri 4
IBT 3 2024-2025
Rania El Ghalbzouri 1
IBT 3 2024-2025
, Table of Contents
Mindmaps ............................................................................................................... 3
Chart Analysis ......................................................................................................... 4
Storyboards ............................................................................................................. 5
Biases ..................................................................................................................... 6
Guest Lecture 1: Marketing Content .......................................................................... 7
Guest Lecture 1: Marketing KPI’s ............................................................................... 9
Guest Lecture 2: HR Content .................................................................................. 10
Guest Lecture 2: HR KPI’s ....................................................................................... 12
Guest Lecture 3: Supply Chain Content ................................................................... 13
Guest Lecture 3 : Supply Chain KPI’s ....................................................................... 16
Guest Lecture 4: Finance Content ........................................................................... 17
Guest Lecture 4: Finance KPI’s ................................................................................ 20
Book Summary ...................................................................................................... 21
Introduction ....................................................................................................... 21
Chapter 1: Driven by data, decisions, or preferences? ........................................... 22
Chapter 2: Decisions .......................................................................................... 24
Chapter 3: Questions .......................................................................................... 27
Chapter 4: Data .................................................................................................. 30
Chapter 5: Answers ............................................................................................ 33
Chapter 6: Data for a purpose .............................................................................. 36
Conclusion: A New Division of Labor .................................................................... 40
Rania El Ghalbzouri 2
IBT 3 2024-2025
, Mindmaps
What is a mindmap
A mind map is a visual tool that organizes information around a central idea, branching
out into related topics and subtopics. It uses keywords, images, and colours to simplify
complex ideas, enhance memory, and support brainstorming, planning, and problem-
solving. Mindmaps offer a number of benefits such as:
➢ Enhanced Creativity and Idea Generation: Visually linking concepts sparks
innovative thinking.
➢ Improved Memory: Mirrors the brain's natural structure, aiding in retention through
visual cues.
➢ Better Organization of Thoughts: Breaks down and arranges ideas logically.
➢ Simplifies Complex Information: Makes challenging topics clear and digestible.
➢ Encourages Focus: Requires attention to detail and active engagement.
➢ Facilitates Problem-Solving: Provides a comprehensive view of challenges to
identify effective
How to make a mindmap
➢ Start with the Main Topic: Place the central idea in
the middle of the page.
➢ Add Branches and Sub-branches: Extend
branches outward from the central idea for related
topics and break them into smaller detail s.
➢ Use Colors and Images: Add visual elements to
make the map engaging and easier to remember.
➢ Connect Related Ideas: Draw lines or arrows to
link related branches or concepts.
➢ Use Keywords and Short Phrases: Keep the
content concise to ensure clarity and focus
Example of a “good” mindmap
Rania El Ghalbzouri 3
IBT 3 2024-2025
, Chart Analysis
The seven steps to interpret a chart
➢ Understand the Title: The title provides the main topic
or purpose of the chart.
➢ Examine the Axes: Identify what the x-axis and y-axis
represent to understand the variables being compared.
➢ Analyze the Chart: Look at the data points, lines, bars,
or other elements to grasp the overall structure.
➢ Look for Trends: Identify patterns, such as increases,
decreases, or consistent behaviour.
➢ Spot Deviations: Note any outliers, sharp changes, or
irregularities.
➢ Ask Questions: Consider what the chart tells you and
what further questions it raises.
➢ Imagine a Story: Use the insights to form a narrative that explains the data and its
implications.
Example
➢ Understand the Title: "America is Carrying the G7,"
➢ Examine the Axes: While there are no traditional
axes, I would say the Y-axis would list the countries
and X-axis would display the percentages in GDP
Share.
➢ Analyse the Chart: The chart highlights the
economic dominance of the US within the G7.
➢ Look for Trends: The chart reflects an increasing
trend in the US's economic dominance. It is noted
that the US's share of G7 GDP has risen by 10
percentage points since 1980.
➢ Spot Deviations: The United States is a clear
outlier, contributing a far larger share of GDP
compared to other G7 countries.
➢ Ask Questions: What are the effects of this
economic imbalance within the G7?
What factors have driven the US's rise in economic
dominance?
➢ Imagine a Story: This chart tells the story of the US as the economic leader of the G7.
Its dominance may lead to greater influence over the group's policies and
negotiations, while also raising concerns about economic disparities and their
potential impact on global cooperation and stability.
Rania El Ghalbzouri 4
IBT 3 2024-2025