This document provides you with a unique combination of lecture and seminar (practicum) information essential for you to pass the exam. It explains in depth examples discussed in class, as well as more detailed exercises from the practicums. The summary also provides all the crucial theoretical con...
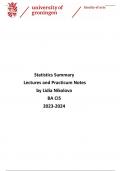
Statistics Summary
Lectures and Practicum Notes
by Lidia Nikolova
BA CIS
2023-2024
,
, Block 1, week 1 - Lecture 1, 07/09/2023
Goals of this course:
- Get an understanding of descriptive (describing a population) and inferential statistics
(computing p-values and assessing if difference between numbers is significant)
- Statistical reasoning – by completing lecture exercises and practicums.
- There is practical approach, but some calculation are done to understand principles
- We will learn how to understand and apply basic analyses
- How to report statistical analyses and understand them
What we will learn in this course:
1. In terms of descriptive statistics we will learn:
The differences between measures for central tendency and spread.
Measure for central tendency is the mean (sum of all scores divided by the number of
participants)
Variation – by looking at the range (the minimum and the maximum value)
We can also summarize in terms of visualizations e.g., bar plot.
Descriptives is one variable at a time, summarizing that single variable for a sample.
2. Inferential statistics are about multiple variables (CIS and LING students) to generalize the
outcome of a sample to a population:
- Compare two groups (or a single group with fixed values like grades between males and
females)
- Check associations between two variables (e.g. is my English pronunciation related to the
grade I received in high school)
3. Internal consistency of questions in a questionnaire, how to run statistical tests in R
4. Creating lab reports
Basic Functions of R:
- Use as a calculator (adding, multiplying)
- Storing values in variables (a <- 5)
- Adjust a variable (b <- a*a, b= 25)
- d <- NA (if means is missing)
- Storing multiple values in a variable (b <- c (2, 4, 6, 7, 8) – function ‘c’ to
combine
- To add a number on a specific position b [4] <- a
▪ [1] 2 4 6 5 8
- Function ‘mean’ to calculate the mean score
- If we have missing values in our dataset the mean will not be computed, that’s why we
need a function that will ignore the NAs
▪ mean (b, na.rm = TRUE)
- To check the structure of the data frame use function str(), how many variables
, - To view parts of the data frame:
o Dat [a,b]
o a gives selected rows of dat – dat [1, ]
o b gives selected columns of dat – dat [, 1]
o don’t forget the comma
- data can be viewed by columns by means of names for the columns (variable names):
o dat[c(1 ,3, 5), c(“participant”, “study”) #rows 1, 3, 5 and 3
named columns
- A single column can also be selected by means of ‘$’ function: dat$gender (getting
the column gender of the dataset dat)
- Saving selected data tmp <- dat[5:8, c(1,3)]
Q1: How can we select the value in the third column, fourth row of dataset dat?
A. dat[4,3]
B. dat[3,4]
C. dat[3,]$4
D. dat[4,]$3
If within a data frame want to select specific cases, for example only interested in male
participants we can use CONDITIONAL INDEXING:
tmp <- dat[dat$gender == “M”,]
To combine conditions use ‘&’:
tmp <- dat[dat$gender == “M” & dat$study == “IS”]
To turn a conditional indexing around: ‘!=’
#only women (i.e., not men) *or* everybody with a grade higher than 7
Tmp <- dat[dat$gender != “M” | dat$english_grade > 7, ]
Add data to columns:
Dat$diff <- dat$english_grade – dat$english_score #this column will contain
info about the difference of English grade and English score
If I want to indicate whether people failed or passed then:
dat$pass_fail <- “pass” #new column, initially everybody passes
dat[dat$english_grade < 5.5, ]$pass_fail <- “fail” #if grade too low, then fail
head(datpdat$english_grade > 4 ^ dat$english_grade < 6,]) #show subset of data
If I create a new variable I first all the values to one specific value and then adjust the cases that
do not meet the criteria.
Basi options to visualize data in R;
- barplot() - barplot
- plot() - plot
The benefits of buying summaries with Stuvia:
Guaranteed quality through customer reviews
Stuvia customers have reviewed more than 700,000 summaries. This how you know that you are buying the best documents.
Quick and easy check-out
You can quickly pay through credit card or Stuvia-credit for the summaries. There is no membership needed.
Focus on what matters
Your fellow students write the study notes themselves, which is why the documents are always reliable and up-to-date. This ensures you quickly get to the core!
Frequently asked questions
What do I get when I buy this document?
You get a PDF, available immediately after your purchase. The purchased document is accessible anytime, anywhere and indefinitely through your profile.
Satisfaction guarantee: how does it work?
Our satisfaction guarantee ensures that you always find a study document that suits you well. You fill out a form, and our customer service team takes care of the rest.
Who am I buying these notes from?
Stuvia is a marketplace, so you are not buying this document from us, but from seller lidianikolova. Stuvia facilitates payment to the seller.
Will I be stuck with a subscription?
No, you only buy these notes for $7.93. You're not tied to anything after your purchase.