This document contains detailed explanations of all SPSS practice sessions for MTO-B. Since you can bring your SPSS step-by-step plan to the exam, you already have it complete with this summary.
SPSS Samenvatting
Session 1: descriptive statistics
Assignment 1: Introduction to SPSS
Aan de linkerkant van de pagina “data view” staat de kolom met de “cases”. Bovenaan in de kolom
staat de rij met “variables”.
In de pagina “variable view” staan “columns” beschreven.
- Name: short variable name.
- Lable: longer description of the variable.
- Values: the meaning of the values.
- Measure: the level of measurement of the variable.
Als een variabele een nominale measurement heeft, betekent dit dat hij ook een “value” heeft.
Assignment 2: descriptive statistics
Frequency distribution: Analyze descriptive statistics frequencies. Put the variables in the right
box.
Om te kijken hoeveel “participants” er zijn kijk je naar “N”. Hierachter staat hoeveel participanten er
deel hebben genomen.
Het percentage van de participanten die een bepaalde variabele is (zoals smoker), zie je waar de
variabele (smoker) met “percent” kruist.
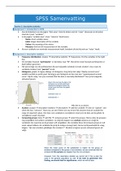
Histogram: graphs legacy dialogs histogram. Zorg dat je het vakje “display normal curve”
aanklikt voordat je verder gaat. Nu krijg je een histogram te zien met een “superimposed normal
curve”. Bij de vraag “can you conclude that the data is normally distributed?” kun je het volgende
antwoord geven:
Mits het er zo uitziet.
Analyse: analyze descriptive statistics descriptives add the variables click on “options” and
check the box “variance”. Now you can see if there are any errors like answers that are outside the
range of expected values. Om deze rare variabele te verwijderen moet je in de data set de gehele rij
verwijderen waarin hij staat.
Comparing groups: Data split file compare groups select the groups. Hierna wil je de groepen
nog vergelijken met andere variabelen. Je volgt de stappen van analyse opnieuw en voegt de
variabelen toe waarmee je de groepen wilt vergelijken. (de variabele die je bij compare groups in vult
moet values hebben, de variabele die je bij de analyse invoegt niet). Nu kun je bijvoorbeeld de vraag
krijgen: “zijn non-smokers gelukkiger dan smokers?”. Bij deze vraag kun je een antwoord geven als
volgt:
,Assignment 3: computing variables
In het codeboek kun je vinden wat er wordt gemeten voor elke variabele.
Wanneer er wordt gevraagd wat het percentage is dat respondenten bijvoorbeeld een score lager dan
7 hebben, kijk je naar het cumulatieve percentage van de score daaronder (bijvoorbeeld 6).
Compute new variables: transform compute variable specify the new name of the new variable
in the upper left (target variable) enter the formula in the “numeric expression” box. De nieuwe
variabele zal nu in je data set staan. Always verify that the computation succeeded dit doe je met
de frequency distribution.
Missing value: er kan een score zijn (zoals 99) die betekent dat de respondent de vraag niet heeft
ingevuld: missing value. Om SPSS dit te laten weten moet je naar variable view gaan click in the
column “missing” of the variables fill in the value (99) in the “discrete missing values” box. Now you
will have to recompute. SPSS gaat je waarschuwen dat dit de vorige output zal veranderen hier
mag je “yes” op antwoorden.
Percentage of missing values: vind je bij het kopje “missing system”
Percentage: gives percentage based on the total number of participants in the sample.
Valid percentage: gives percentage based on the number of participants that have a value on this
variable.
Recoding: another way to create new variables. Transform recode into different variables select
an input variable rename it with “rec” behind it’s original name, this is the output variable. click
“change” to add another variable you want to recode click the button “old and new values”, here
you can specify how you want the recoding to happen. If you have values like “-10 to -1” you would
want to change to, by example, “1”, you click the button “range” fill them in add the new value
(1) click “add”. If you have values like “0” you want to change to “2”, by example, you click value
fill in the old value add the new value click “add”. After you’re done you can click “continue” and
“ok”. check your variable view to see if the new variables were added.
Value labels: in variable view click “values” to specify the new value labels you’ve come up with.
Use the valid percent when answering research questions.
Mean of the variable: een “mean” onder de 0 betekent een algemene afname in ……(de variabele).
Een “mean” boven de 0 betekent een algmene toename in …… (de variabele).
Assignment 4: Entering data
Adding variables to an empty data set: wanneer je variabelen in je data set wilt zetten moet je naar
“variable view” gaan bij “name” de variabelen toevoegen eventueel “values” toevoegen.
Data invoeren: ga naar data view voer de data in.
Scatter plot: used to examine hypotheses. Graphs legacy dialogs scatter/dot simple scatter
define put the right variables in the “x-axis” and the “y-axis” click ok. Wanneer er wordt
gevraagd of de scatter plot de hypothese ondersteunt kun je bijvoorbeeld zo antwoorden:
, Generalizability: er kan gevraagd worden of de research generaliserend is voor de gehele populatie.
een antwoord mogelijkheid is:
Assignment 5: missing values
Missing values: holes in the data set, that can arise for many reasons.
Wanneer een dataset veranderd door “missing values” kun je dat zien in de frequency tabellen van
voor en na. Je kijkt hier dan naar: percent & valid percent. Je zult dan zien dat de valid percent
bijvoorbeeld niet meer gelijk is aan de percent. Dit komt doordat:
Percentage is obtained by dividing the observed frequency by the total N (including respondents with
a missing value), whereas Valid Percentage is obtained by dividing the observed frequency by the
number of respondents with a valid score (thus, not counting the persons who had a missing value).
Wanneer de percentages dus MISSEN, kun je ze zelf uitrekenen (computing by hand) bij percent: de
frequency / N(+missing respondents) = ….. Bij valid percent doe je: de frequency / N(-missing
respondents) = …….
Lege cellen (system missing) zijn prima, maar het werkt beter om ze een code te geven, zoals 999. Om
dit te doen ga je naar data view vul je een code in voor de missing values (zoals 999) ga naar
variable view ga naar de column “missing” vul de missing value (999) in voor de variabele waar
hij bij staat nu weet SPSS dat (bijvoorbeeld 999) staat voor een “missing observation”.
De reden dat het beter is om de missing value een code te geven is: in real research there may be
different reasons for a missing value. For example, a respondent may give an invalid answer (For
example: (s)he did respond but the answer is useless, the answer was unreadable, or (s)he did not
respond at all). In that case you may use different codes for different types of missings, and later on in
the output you can easily see the frequencies for the different types of missingness.
Assignment 6: a real life example
Toepassing van de vorige assignments.
1. take care of the labelling of variables.
2. define missing values.
3. check the data for invalid scores or out of range values. (tip: check de table rij “valid”)
4. selecting the study sample.
- Select cases: data select cases select “if condition is satisfied” click on “if” specify the
selection. For example:
5. descriptive data analysis.
- Wanneer de vraag wordt gesteld of we een significant verband zien of dat we het nu kunnen
generaliseren naar de populatie is het antwoord vrijwel altijd nee, omdat we niet hebben getest voor
significantie. Het kan dus ja zijn als je WEL voor significantie hebt getest.
The benefits of buying summaries with Stuvia:
Guaranteed quality through customer reviews
Stuvia customers have reviewed more than 700,000 summaries. This how you know that you are buying the best documents.
Quick and easy check-out
You can quickly pay through credit card or Stuvia-credit for the summaries. There is no membership needed.
Focus on what matters
Your fellow students write the study notes themselves, which is why the documents are always reliable and up-to-date. This ensures you quickly get to the core!
Frequently asked questions
What do I get when I buy this document?
You get a PDF, available immediately after your purchase. The purchased document is accessible anytime, anywhere and indefinitely through your profile.
Satisfaction guarantee: how does it work?
Our satisfaction guarantee ensures that you always find a study document that suits you well. You fill out a form, and our customer service team takes care of the rest.
Who am I buying these notes from?
Stuvia is a marketplace, so you are not buying this document from us, but from seller ellekoning. Stuvia facilitates payment to the seller.
Will I be stuck with a subscription?
No, you only buy these notes for $6.82. You're not tied to anything after your purchase.