This document is a summary of Chapters 2, 26, 27 & 29 of 'Principles of Economics, 3rd European Edition', Chapters 10, 11, & 15 of 'Mishkin' as well as Chapters 8, 16 & 17 of 'Nello' included in the educational programme for the course AEC 2 ().
general economics principles of economics aec alec 2
Connected book
Book Title:
Author(s):
Edition:
ISBN:
Edition:
More summaries for
College aantekeningen ECT - Economics and Tourism (CBTO1ECT) Principles Of Economics, ISBN: 9780077132736
Samenvatting Principles Of Economics, ISBN: 9780077132736 ECT - Economics and Tourism (CBTO1ECT)
Economics for IB Midterm Summary
All for this textbook (13)
Written for
Nyenrode Business Universiteit (Nyenrode)
BSC accountancy
ALEC 2
All documents for this subject (2)
Seller
Follow
fellow
Content preview
Summary ALEC2 | 2019 | Nyenrode Business Universiteit 1
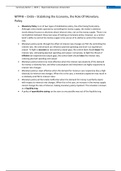
MTPFB – CH26 – Stabilising the Economy, the Role Of Monetary
Policy
• Monetary Policy is on of two types of stabilisation policy, the other being fiscal policy.
Although central banks operate by controlling the money supply, the media’s attention
nearly always focuses on decisions about interest rates, not on the money supply. There is no
contradiction between these two ways of looking at monetary policy, however, as a central
bank’s ability to control the money supply is the source of its ability to control the interest
rate.
• Monetary policy works through the effect of interest rate changes on PAE. By controlling the
interest rate, the central bank can influence planned spending and short-run equilibrium
output. To fight a recession (a recessionary output gap), the central bank should lower the
interest rate, stimulating planned spending and output. Conversely, to fight the threat of
inflation (an expansionary output gap), the central bank should raise the interest rate,
reducing planned spending and output.
• Monetary policy tends to be most effective when the interest rate elasticity of the demand
for money is relatively low, and when consumption and investment are highly responsive to
interest rate changes.
• Monetary policy is least effective when the demand for money is very responsive (has a high
elasticity) to interest rate changes. When this is the case, a monetary expansion may result in
a relatively small fall in interest rates.
• Monetary policy will be totally ineffective when the demand for money is perfectly elastic
with respect to interest rate changes. When this is the case, an increase in the money supply
cannot change the rate of interest, making monetary policy impotent. This situation is known
as a liquidity trap.
• A policy of quantitative easing can be seen as one possible way out of the liquidity trap.
, Summary ALEC2 | 2019 | Nyenrode Business Universiteit 2
MTPFB – CH27 – Aggregate demand, aggregate supply and inflation
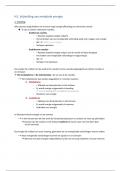
• The aggregate demand (AD) curve shows the relationship between short-run equilibrium
output and inflation. Because short-run equilibrium output is equal to planned spending, the
aggregate demand curve also relates spending to inflation. Increase in inflation reduce
planned spending and short-run equilibrium output, so the aggregate demand curve is
downward-sloping.
• The inverse relationship of inflation and short-run equilibrium output is the result, in large
part, of the behaviour of the central bank. To keep inflation low and stable, the real interest
rate reduces consumption and planned investment, lowering planned aggregate expenditure
and hence short-run equilibrium output. Other reasons that the AD curve slopes downwards
include the effects of inflation on the real value of money, distributional effects (inflation
redistributes wealth form the poor, who save relatively little, tot the more affluent, who save
more), uncertainty created by inflation and the impact of inflation on foreign sales of
domestic goods.
• For any given value of inflation, an exogenous increase in spending (that is, an increase in
spending at given levels of output and the real interest rate) raises short-run equilibrium
output, shifting the AD curve to the right. Likewise, an exogenous decline in spending shifts
the AD curve to the left. The AD curve can also be shifted by a change in the central bank’s
policy reaction function. If the central bank gets ‘tougher’, shifting up its reaction function
and thus choosing a higher real interest rate at each level of inflation, the AD curve will shift
to the left. If the central bank gets ‘easier’, shifting down its reaction function and thus
setting a lower real interest rate at each level of inflation, the AD curve will shift tot the right.
• The SRAS curve shows the relationship between aggregate output and inflation.
Unanticipated changes in inflation are a key reason explaining why the SRAS curve slopes
upwards. When an increase in inflation is unanticipated and not reflected in nominal
contracts, firms find it profitable to increase output and employment.
• A revision in inflationary expectations and new information leads to shifts in the SRAS curve.
Higher expected inflation or an announcement of an easier monetary policy will shift the
SRAS curve to the left. Conversely, lower expected inflation or an announcement of a tighter
monetary policy will shift the SRAS curve to the right.
• The economy is in short-run equilibrium when inflation equals the value determined by
expected inflation and output equals the level of short-run equilibrium output that is
consistent with that inflation rate. Graphically, short-run equilibrium occurs at the
intersection of the AD curve and the SRAS curves.
• The economy is in long-run equilibrium when actual output equals potential output (there is
no output gap) and the inflation rate is stable. Graphically, long-run equilibrium occurs when
the AD curve, the SRAS curve and de LRAS curve intersect at a common point. The LRAS
curve is a vertical line at the economy’s potential output Y*.
• Inflation adjusts gradually to bring the economy into long-run equilibrium (a phenomenon
called the economy’s self-correcting tendency). Inflation rises to eliminate an expansionary
gap and falls to eliminate a recessionary gap. Graphically, the SRAS curve moves up or down
as inflationary expectations are revised. The more rapid the self-correction process, the less
need for active stabilisation policies to eliminate output gaps.
• Demand and supply shocks are important sources of inflation. They can lead to a change in
the equilibrium inflation rate but the do not lead to permanent output changes. For this
reason they are referred to as nominal shocks.
The benefits of buying summaries with Stuvia:
Guaranteed quality through customer reviews
Stuvia customers have reviewed more than 700,000 summaries. This how you know that you are buying the best documents.
Quick and easy check-out
You can quickly pay through credit card or Stuvia-credit for the summaries. There is no membership needed.
Focus on what matters
Your fellow students write the study notes themselves, which is why the documents are always reliable and up-to-date. This ensures you quickly get to the core!
Frequently asked questions
What do I get when I buy this document?
You get a PDF, available immediately after your purchase. The purchased document is accessible anytime, anywhere and indefinitely through your profile.
Satisfaction guarantee: how does it work?
Our satisfaction guarantee ensures that you always find a study document that suits you well. You fill out a form, and our customer service team takes care of the rest.
Who am I buying these notes from?
Stuvia is a marketplace, so you are not buying this document from us, but from seller fellow. Stuvia facilitates payment to the seller.
Will I be stuck with a subscription?
No, you only buy these notes for $3.49. You're not tied to anything after your purchase.