100% satisfaction guarantee Immediately available after payment Both online and in PDF No strings attached
logo-home
Summary MR lecture notes $4.24
Add to cart

Summary

Summary MR lecture notes

 55 views  1 purchase
  • Course
  • Institution

Marketing Research notes of lessons, also important information from the book is added.

Preview 4 out of 68  pages

  • June 28, 2020
  • 68
  • 2019/2020
  • Summary
avatar-seller
Marketing Research

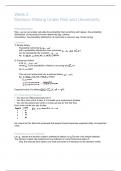
Lecture 1: Research Design / Secondary Data

Introduction to marketing research
Marketing research is the systematic and objective identification, collection, analysis and dissemination of
information for the purpose of improving decision making related to the identification of problems and
opportunities in marketing.
Marketing Research Process:
1. Defining a problem
2. Develop an approach
3. Formulate research design
4. Fieldwork or data collection
5. Data preparation & analysis
6. Report preparation

1. Problem Definition
 Broad statement of the general problem and clarify the marketing decision problem
 Take into account the purpose, background information and information needed
 Define research problem and question
 Create mutual understanding and agreement (between researcher and decision maker)
 Confirm information value
 Should guide the researcher in proceeding with the project.

Management Decision Problem: asks what the decision maker needs to do, action oriented. For example:
‘’What can we do to retain talented workforce?’’ & ‘’How can we make the city more attractive?’’
Marketing Research Problem: asks what information is needed and how it should be obtained, information
oriented. For example: ‘’How attractive is the city currently?’’ & ‘’What aspects influence the attractiveness?’’

To come from Management Decision Problem to Marketing Research Problem, we need to perform certain
tasks: discussion with decision makers, interviews with experts, secondary data analysis, qualitative research.

Decision Makers
Researchers should interact with the DM (decision maker). A problem audit, which involves extensive
interaction between the DM and the researchers, can greatly facilitate problem definition by determining the
underlying causes. The interaction between the DM and the researcher should be characterized by the seven Cs:
1. Communication: Free exchange of ideas between the DM and researcher
2. Cooperation: Marketing research is a team project where both parties communicate
3. Confidence: The interaction between the DM and the researcher should be guided by mutual trust
4. Candor: There should be no hidden agendas, openness is key.
5. Closeness: Feelings of warmth and closeness should characterize the relationship between both
6. Continuity: The DM and the researcher must interact continually rather than sporadically
7. Creativity: The interaction between the DM and the researcher should be creative

2. Development of an approach
Step 1  Objective / Theoretical framework
> Research should be based on objective evidence (= unbiased evidence) and supported by theory
> Which variables (‘’constructs’’) should be investigated?
> Based on academic literature, general empirical findings
Step 2  Analytical Model
> Explicit specification of variables and their interrelationships.
> Can be presented in three ways:
Verbal model  written representation of the relationships between variables
Graphical model  provide visual picture of the relationship between variables
Mathematical model  describe relationship between variables in equation form
Step 3  Research Questions
> Refined statements of the specific components of the problem
> Asks specific information with respect to the problem components.

,Step 4  Hypotheses
> Unproven / tentative statements about relationship between two or more variables.
> A possible answer to each research question
> Can be tested empirically
Step 5  Specification of Information Needed
> Based on step 1 – 4, the researcher can make a list specifying all the information that should be
collected.

3. Research design formulation
 Framework for conducting the marketing research project
 Research design lays the foundation for conducting the project
 Defines (1) the information needed, (2) research design type (exploratory, descriptive, causal).
(3) measurement and scaling procedure (4) questionnaire or appropriate form of data collection (5) sampling
process and sample size (6) plan of data analysis.

Research Design Types
Exploratory  discover ideas, insights, understanding process, experts, qualitative research, can be used before
using descriptive / causal research to get an understanding of the problem.
Descriptive  describing important characteristics, surveys, panels, quantitative research; can be defined into
cross-section or longitudinal research (= longer period of time, fill in survey every two months). Cross-section
can be divided into single and multiple. Difference longitudinal and multi cross-section is that cross-section
measures not the same exact group of people whereas longitudinal measures the same sample.
Causal  determine cause-effect relations, experiments
!! Descriptive & Causal research design together are called conclusive research.
Difference between Types


6 Ws for Research Design
 Why? = MDP
 What? = MRP + Research Questions
 Way = type (exploratory, descriptive, causal), method of data collection, method of analysis
 Who = population, target group > sampling frame > sampling method, sample size
 When
 Where

,Potential Sources of Error
Total error is the variation between the true mean value in the population of the variable of interest and the
observed mean value obtained in the marketing research project


Secondary Data
Secondary data is data collected for some purpose other than the problem at hand. Marketing Journals can
provide such information. Advantage is that is can be located quickly, lower costs and collected rapidly & easily.
Primary data are originated by a researcher for the specific purpose of addressing the problem at hand.
Disadvantage: can be expensive and time-consuming
Difference between Primary and Secondary data
Primary data Secondary data
Collected for Problem at hand Similar problems
Cost Expensive Inexpensive
Time Takes longer Takes little time
Actuality Current Older
Relevance High Potentially low
Source Known Trusted?
Process Very involved Rapid and easy

When to use Secondary Data?
 Malhotra: start with secondary data, when exhausted; collect primary data (general rule)
 It helps to (1) identify the problem (2) define the problem (3) develop an approach to the problem (4)
formulate appropriate research design (5) answer certain research questions and test hypothesis (6) interpret
primary data more insightful.
 Disadvantages: collected for other purposes than the problem at hand, relevance and accuracy may not be
appropriate to the present situation.
 Be critically and evaluate the quality/suitability of secondary data (methodology, errors, objective)
1. Specification or methodology used to collect data should be critically examined
2. No errors in approach, research design, sampling, data collection, analysis and reporting should occur
3. Value of secondary data is diminished as they become dated
4. Is the information relevant and useful?
5. Check the content of the data
6. Examining expertise, credibility, reputation and trustworthiness of the source indicates the overall
dependability of the data

, Classification of secondary data


Secondary data can be classified into internal (within the company) & external data (other sources). Internal &
External data can be further divided into where secondary data can be found.

Internal Secondary Data
 Consists of customer databases, data warehouse, customer relationship management (CRM) system
 Advantages: easily available, inexpensive, starting point for secondary data, powerful insights might come
from in-house information
External Secondary Data
 Come from business/nongovernment data, government data and syndicated services.
 Business data = books, journals, periodicals, newspapers, magazines, reports, trade literature
 Government data = census data (= demographic data about household, sex, age, marital status, race etc).
 Syndicated data = Syndicated sources from Households (syndicated panel surveys, purchase panels, media
panels, Nielsen scanner data, volume tracking data & scanner panels with cable TV), Syndicated data from
Institutions (audit & industry services)

The benefits of buying summaries with Stuvia:

Guaranteed quality through customer reviews

Guaranteed quality through customer reviews

Stuvia customers have reviewed more than 700,000 summaries. This how you know that you are buying the best documents.

Quick and easy check-out

Quick and easy check-out

You can quickly pay through credit card or Stuvia-credit for the summaries. There is no membership needed.

Focus on what matters

Focus on what matters

Your fellow students write the study notes themselves, which is why the documents are always reliable and up-to-date. This ensures you quickly get to the core!

Frequently asked questions

What do I get when I buy this document?

You get a PDF, available immediately after your purchase. The purchased document is accessible anytime, anywhere and indefinitely through your profile.

Satisfaction guarantee: how does it work?

Our satisfaction guarantee ensures that you always find a study document that suits you well. You fill out a form, and our customer service team takes care of the rest.

Who am I buying these notes from?

Stuvia is a marketplace, so you are not buying this document from us, but from seller nikkinuman. Stuvia facilitates payment to the seller.

Will I be stuck with a subscription?

No, you only buy these notes for $4.24. You're not tied to anything after your purchase.

Can Stuvia be trusted?

4.6 stars on Google & Trustpilot (+1000 reviews)

48072 documents were sold in the last 30 days

Founded in 2010, the go-to place to buy study notes for 15 years now

Start selling
$4.24  1x  sold
  • (0)
Add to cart
Added