100% satisfaction guarantee Immediately available after payment Both online and in PDF No strings attached
logo-home
Samenvatting Methodologie 2 Tentamenstof DT 1 – alle colleges $3.16
Add to cart

Summary

Samenvatting Methodologie 2 Tentamenstof DT 1 – alle colleges

 25 views  0 purchase
  • Course
  • Institution

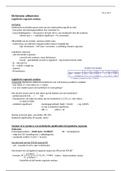
Methodologie 2 college aantekeningen. Dit bestand bestaan uit alle colleges die zijn gegeven tijdens het vak Methodologie 2 (AB_). Schrik niet van het aantal pagina's, want dit komt door de vele ondersteunde plaatjes uit de dia’s (hierdoor wordt de stof nog duidelijker). Dit vak is een verplicht ...

[Show more]
Preview 4 out of 33  pages

  • September 8, 2020
  • 33
  • 2019/2020
  • Summary
avatar-seller
HC 6, 20-9
Dichotome uitkomsten
Logistische regressie-analyse

Herhaling
Statistische technieken geven antw op een onderzoeksvraag die je stelt.
- hoe groter de toetsingsgrootheid, hoe vreemder H 0.
- overschrijdingskans -> hoe groot is de kans als H 0, een steekproef met dit resultaat.
- kleiner dan  -> statistisch significant -> H0 verwerpen.

Afhankelijk van de situatie, wanneer welke toets.
- meetniveau van uitkomst, bepaalt welke toetsen mogelijk zijn.
- bijv. dichotoom – Chi2 (met ..correctie) , z-verdeling, lineaire regressie,

Logistische regressie
- veel als lineaire regressie.
- verschil niet continue, maar dichotoom.
- lineair – gemiddelde verschil vs logistisch – log transformeerde odds.
- B0 – die ook 0 is
- B1 – schuift 1 stapje op.
- toetsen.
- BI berekenen.


Logistische regressie-analyse
Voorbeeld: dichotome uitkomst (hartinfarct) met 1 dichotome predictor variabele.
- met roken: 0 = niet-roken en 1 = roken.
- Is er een relatie tussen een hartinfarct en rook gedrag?

Het verschil tussen wel en niet roken op het hebben van een hartinfarct?
- geïnteresseerd in B1 -> 0,8
- interpreteren: de odds van rokers op een hartinfarct is 2,23 t.o.v. niet-rokers.
- ln odds is 0,800.
- statistisch significant: - toetsingsgrootheid, Wald = 10,623 -> sig. 0,001%
- Ja, het is statistisch significant.
- OR = 1 (effect = 0)

Sterkte en kracht (gem. verschillen, RR, OR,)
Statistisch significantie (P-waarde, toets)


Toetsen of er sprake is van statistische significantie bij logistische regressie
Wald toets
Toetsingsgrootheid -> Wald toets = (b/SE(b))2 (SE – toetsingsfout)
- volgt een Chi2 verdeling met 1 vrijheidsgraad.
- voorbeeld: (0..245)2 = 10.6231.

Aan de hand van het 95% BI rond de OR
- valt .. (waarde H0) erin, dan H0 behouden.

Hoe komen we via logistisch regressie ouput aan OR en het 95% BI?
p ( infarct )
- formule: ln ( )
1- p ( infarct )
=b0 +b 1 × roken (roken – determinanten status)

- hetzelfde als bij lineaire regressie analyse.

,- voorbeeld: - voor roken: ln(odds) = b0 + b1
- voor niet-roken: ln(odds) = b0
-> ln(odds)roken – ln(odds)niet-roken = (b0 + b1) – b0 = b1
- verschil tussen log-oddsen
- het verschil tussen groepen -> OR = EXP(b 1)
- want: ln[(odds)roken/(odds)niet roken] = b1 & ln(OR) = b1
-
voorbeeld: - OR = EXP (0,800) = 2,23
- 95% BI – EXP(b± 1,96 x SE(b)) = EXP(0,800 ± 1,96 x 0,245)
- 95% BI is 1,38 – 3,60 (log getransformeerd rond OR).
(0,32 – 1,28.. nemen tot e macht)
- toetsingswaarde is 1, dus valt erbuiten -> H 0 verwerpen.
(- SE Standaardfout = wortel (1/a + 1/b + 1/c + 1/d))

p ( Y =1 )
Regressie model voor een dichotome uitkomstvariabele, formule: ln ( )
1−p ( Y =1 )
=b0 +b1 X


Logistisch model – transformeren naar de kans
- regressiemodel, voor elke mogelijke uitkomst, kans berekenen:
- voorbeeld: 4 mogelijkheden.
1
- formule: p ( Y =1 )= − ( b 0+b 1 X )
1+e
1
- voorbeeld niet-rokers(0): P ( Y =1 )= − ( −0.171 )
=0.46
1+e
- kans op infarct voor niet-rokers is 46%.
1
- voorbeeld rokers(1): P ( Y =1 )= − ( −0.171+0.800 )
=0.65
1+e
- kans op infarct voor rokers is 65%.
- : rokers + niet-rokers (b0 + b1)

Likelihood-ratiotoets
- voorwaarde -> n-verdeling
- 0 en 1 niet passen
- rekenen met log getransformeerd

Aannemelijk van je model zo groot mogelijk maken.

Likelihood -> product van alle kansen voor iedere persoon gegeven de waarden voor de determinanten.
1. bereken eerst de kans voor alle combinaties (tussen determinantstatus en uitkomstmogeliikheden o.b.v.
1
formule: p ( Y =1 )= − ( b 0+b 1 X ) (4x)
1+e
- 4 mogelijke situaties. -->
- complement regel (1 – kans).

2. vermenigvuldig berekende kansen maal aantal personen met specifieke combinatie.
- likelihood: (0.65)60 x (0.35)32 x (0.46)150 x (0.54)178 = 571.20
- likelihood is heel klein -> -2 log (likelihood)
- wat kan je ermee:
- model met roken: -2 ln [(0.65) 60 x (0.35)32 x (0.46)150 x (0.54)178]= 571.20
- getal zegt niet zoveel.
- hoe groter dit getal, hoe meer er aan de hand zal zijn.
- model zonder determinanten: (50% cases, dus kans op een hartinfarct = 0.5):
- -2 ln [(0.5)420] = 582.24
- hoe kleiner, 2 ln.. -> minder kan verklaren wie de uitkomst heeft.

,Likelihood – ratiotoets -> vergelijken van 2 modellen met elkaar
- verschil van de -2 log likelihood
- verschil volgt een Chi2 verdeling
- het aantal vrijheidsgraden is gelijk aan het verschil in variabelen (eigenlijk het aantal parameters wat
geschat wordt) tussen de 2 modellen die met elkaar worden vergeleken.
- essentieel: ene model moet een uitbreiding zijn van het andere model.
- de absolute waarde van -2 log likelihood zegt niet zo veel. Omnibus Tests of Model Coefficients
- is alleen belangrijk in het kader van de likelihood-ratiotoets. Chi-s quare df Sig.
Step 1 Step 11,052 1 ,001
Block 11,052 1 ,001
Voorbeeld: 582.24 – 571.20 = 11.04 Model 11,052 1 ,001

- Chi2 verdeelt met 1 vrijheidsgraad. Beroep
- H0 verwerpen
Cumulative
Frequency Percent Valid Percent Percent
Voorbeeld: SPSS output: zie rechts boven. Valid Epidemioloog 151 36,0 36,0 36,0
Statis ticus 125 29,8 29,8 65,7
Anders 144 34,3 34,3 100,0
Total 420 100,0 100,0
Logistische regressie met categoriale determinant Chi-Square Te sts
Vraag: Is beroep een determinant voor het krijgen van een hartinfarct? Asymp. Sig.
- output SPSS: zie hierboven. Value df (2-s ided)
Pears on Chi-Square 4,454a 2 ,108
Likelihood Ratio 4,466 2 ,107
2
Chi : output --> Linear-by-Linear
2,466 1 ,116
Ass ociation
- interpretatie: stel 4,454 met 2vrijheidsgraden (want 3 groepen) N of Valid Cas es
420
en met een overschrijdingskans van 10,8%. a. 0 cells (,0%) have expected count less than 5.
-> groter dan , niet statistisch significant, dus H0 niet behouden. The minimum expected count is 62,50.

- ORs berekenen voor aparte 2x2 tabellen: (kan alleen ene groeps vs andere)
- statisticus vs epidemioloog: (56*79) / (72*69) = 0,89 – beschermend
- anders vs epidemioloog: (82*79)/(62*72) =1,45 – ongunstig
- statisticus vs anders: (56*62)/(69*82) = 0,61 – beschermend
-> alle 3 de groepen op een dichotome uitkomst.

10%
- overal 10,9% , op basis van steek proef dat dit komt uit H 0.
- wald, opzoeken

Alternatief: logistische regressie.
- (nominale) variabelen met meer dan 2 categorieën kunnen niet direct worden geanalyseerd.
- dummy variabelen.
- schrijf regressie vergelijking: y = b 0 + b1 x dummy1 + b2 x dummy2 (b1 en b2 – wie?)
- voorbeeld: epidemioloog is de constante
- b1 -> statisticus t.o.v. epidemioloog
Variables in the Equation
- output: Omnibus Tests of Model Coefficients
B S.E. Wald df Sig. Exp(B)
Chi-s quare df Sig. Step
a
BEROEP 4,431 2 ,109
Step 1 Step 4,466 2 ,107 1 BEROEP(1) -,116 ,243 ,228 1 ,633 ,890
Block 4,466 2 ,107 BEROEP(2) ,372 ,234 2,527 1 ,112 1,451
Model 4,466 2 ,107 Cons tant -,093 ,163 ,324 1 ,569 ,911
a. Variable(s ) entered on step 1: BEROEP.

- log getransformeerde odds op infarct voor statisticus is -0,116 t.o.v. epidemioloog
- OR voor statisticus vs epidemioloog -> EXP (-0.1160 ± 1.96 x 0.2427) = 0.89 [0.55 - 1.43]
- OR voor anders vs epidemioloog -> EXP (.3724 ± 1.96 x 0.2342) = 1.45 [0.92 - 2.30]
- OR voor anders vs statisticu -> verschil tussen log getransformeerde odds tussen (1) en (2)

Logistische regressie met continue determinant

, Vraag: is een hoge body mass index (BMI) een determinant voor het krijgen van een hartinfarct?
- mogelijkheid: t-toets voor 2 onafhankelijke groepen
- echter is dit een ‘omgekeerde’ analyse Independent Samples Test
- uitkomstwaarde: infarct is dichotoom -> dus moet logistische regressie analyse.
t-tes t for Equality of Means
- SPSS output: Group Statistics 95% Confidence
Interval of the
Std. Error
Patient of controle? N Mean Std. Deviation Mean Mean Std. Error Difference
Body mas s index Controle 207 23,2779 2,84530 ,19776 t df Sig. (2-tailed) Difference Difference Lower Upper
Patient 208 24,5916 2,61771 ,18151 Body mass index -4,895 413 ,000 -1,3137 ,26837 -1,84123 -,78613

- OR voor BMI = EXP [0.177 ± 1.96 x 0.038] = 1.19 [1.11 - 1.29]
- OR voor een verschil van 1 eenheid in BMI.
- rekening van regressie coëfficiënten, uiteindelijk e ..
- interessant bijv. OR voor een verschil in 5 eenheden.
- OR voor 5 eenheden BMI = EXP [5 * 0.177 ± 5 * 1.96 x 0.038] = 2.43 [1.67 – 3.53]
- Lineaire relate tussen BMI en hartinfarct.
- is die aanname terecht?
- aangezien BMI een continue determinant is moeten we controleren of de relatie lineair is.
- gebaseerd op theoretisch model: - wiskundige functie.
- continue determinant opdelen in groepen
- op basis waarvan?
Meer output: Variables in the Equation Variables in the Equation

B S.E. Wald df Sig. Exp(B) B S.E. Wald df Sig. Exp(B)
Step NBMI 33,663 3 ,000
Step
a
BMI 1,689 ,501 11,374 1 ,001 5,414 a
1 NBMI(1) ,908 ,296 9,422 1 ,002 2,480
1 BMI2 -,031 ,010 9,301 1 ,002 ,970
NBMI(2) 1,664 ,303 30,062 1 ,000 5,281
Cons tant -22,682 6,206 13,356 1 ,000 ,000
NBMI(3) 1,335 ,298 20,092 1 ,000 3,800
a. Variable(s ) entered on step 1: BMI, BMI2. Cons tant -,985 ,221 19,793 1 ,000 ,373
a. Variable(s ) entered on step 1: NBMI.
- kwadratisch verband
- toets: kwadratisch statistisch significant beter de relatie beschrijft dan lineair verband.
- is hier ook het geval.
- richtingscoëfficiënt lopen die gelijk op/af? (kijk bij de categorieën).
- keuze goed onderbouwen.
- spreekt hier tegen dat er een lineair verband is.
-> BMI geen lineair verband met hebben van infarct.


Confounding & effectmodificatie
Corrigeren voor een confounder?
- als de regressie coëfficiënt van de determinant met meer dna 10% veraners.
- als de regressiecoëfficiënt van de determinant statistisch significant is.
- als de regressiecoëfficiënt van de confounder statistisch significant is.
- als plausibel is dat de relatie tussen determinant en uitkomst door de confounder verstoord wordt.

Effectmodificatie -> het ‘effect’ is ander voor verschillende groepen.
- bijv. ‘effect’ is ander voor mannen dan voor vrouwen, jongeren vs ouderen, etc.
- Voorbeeld: ‘herstel’ frequentie
- verschil is in beide groepen 10%
-> GEEN effectmodificator.
- WEL verschil in proporties: mannen 0% & vrouwen 30%

Confounding -> het gevonden ‘effect’ is (gedeeltelijk) veroorzaakt door
een andere variabele , de confounder.
- voorbeeld, verschil in proporties = 15%.
- onderzoeken m.b.v. gestratificeerde analyses.
- voorbeeld: ‘herstel’ frequenties.
- jong: verschil in proporties 10%
- oud: verschil in proporties 10%
- totaal: – verschil in proporties 15%

The benefits of buying summaries with Stuvia:

Guaranteed quality through customer reviews

Guaranteed quality through customer reviews

Stuvia customers have reviewed more than 700,000 summaries. This how you know that you are buying the best documents.

Quick and easy check-out

Quick and easy check-out

You can quickly pay through credit card or Stuvia-credit for the summaries. There is no membership needed.

Focus on what matters

Focus on what matters

Your fellow students write the study notes themselves, which is why the documents are always reliable and up-to-date. This ensures you quickly get to the core!

Frequently asked questions

What do I get when I buy this document?

You get a PDF, available immediately after your purchase. The purchased document is accessible anytime, anywhere and indefinitely through your profile.

Satisfaction guarantee: how does it work?

Our satisfaction guarantee ensures that you always find a study document that suits you well. You fill out a form, and our customer service team takes care of the rest.

Who am I buying these notes from?

Stuvia is a marketplace, so you are not buying this document from us, but from seller ninaburgering. Stuvia facilitates payment to the seller.

Will I be stuck with a subscription?

No, you only buy these notes for $3.16. You're not tied to anything after your purchase.

Can Stuvia be trusted?

4.6 stars on Google & Trustpilot (+1000 reviews)

51036 documents were sold in the last 30 days

Founded in 2010, the go-to place to buy study notes for 15 years now

Start selling
$3.16
  • (0)
Add to cart
Added