Exam (elaborations)
MATH 225N Week 8 Assignment Correlation Questions-Answers
- Course
- MATH 225N (MATH225N)
- Institution
- Chamberlain College Of Nursing
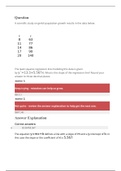
Question: A scientific study on gerbil population growth results in the data below…. The least squares regression line modeling this data is given by yˆ=13.3 5.567x. What is the slope of the regression line? Round your answer to three decimal places. Question: The scatter plot below shows data ...
[Show more]