100% satisfaction guarantee Immediately available after payment Both online and in PDF No strings attached
logo-home
Summary of statistics for the pre-master $7.04   Add to cart

Summary

Summary of statistics for the pre-master

 78 views  0 purchase
  • Course
  • Institution
  • Book

This is a summary of the lectures and book of the statistic course during the pre-master communication and information science at Tilburg University. It covers the chapters of the book 'Discovering statistics using IBM SPSS Statistics' by Andy Field, supplemented with the teaching material that was...

[Show more]

Preview 3 out of 26  pages

  • No
  • Chapter 1,2,4,5,6,8,9,10 and 12
  • October 14, 2020
  • 26
  • 2019/2020
  • Summary
avatar-seller
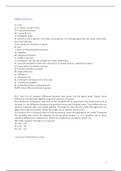
Abbreviations
𝑥̅ = mean
∑= (x-mean)2 for each score.
SD = standard deviation
SE= standard error
P= probability value
𝑏$= the hat on the b stands for the value not being true. It is making explicit that the values underneath
them are estimates.
Error= deviance= deviation= residual.
Σ= sum
z-score= (x-mean)/standard deviation
∝= reliability
Df= degrees of freedom
k= number of groups
r= correlation= tells you the strenght of a linear relationship
R2= squared correlation coefficient= proportion of shared variance= explained variance
Sr2= semi-partial correlation squared
pr2= partial correlation squared
𝐷( = mean difference
𝜇 = difference
𝜎 = standard error
B0 = intercept= starting point on the x-axis
B1 = coefficient= gradient
𝛽= standardized betas= standardized B1
Mdiff= mean difference between groups


SST= Total Sum of Squares= difference between data points and the grand mean. Square these
differences and add them together to get the total sum of squares.
SSM= Model Sum of Squares= how much of this variability can be explained by the model that we fit to
the data. It is the difference bettween the predicted values and the grand mean. These differences are
squared, multiplied with n and added together. The larger the man and the smaller the regression, the
better the model fits the data. Within the model sum of squares, the df is df-1.
SSR= Residual Sum of Squares= how much of the variance cannot be explained by the model? Compares
the variability that cannot be explained by the grouping variable, i.e., the variability due to other
individual differences in performance. Within the residual sum of squares, the df= N-k
SM= Mean squares= Average sum of squares
SST= SSM + SSR
SSM= SST - SSR
SSR= SST – SSM


> Don’t put Greek letters in italics.


1

,2

, Chapter 1 - Basics
Hypothesis
Null hypothesis: H0: assumption that there is no effect.
Alternative hypothesis: H1: assumption that there is an effect.
Most hypotheses can be expressed in terms of two variables: a proposed cause and a proposed
outcome. The key to testing scientific statements is to measure these two variables > Null Hypothesis
Significance Testing (NHST). We can reject the H0 and state that H1 is supported by the data, but we
can’t prove it.

Variables
Independent variable: Proposed cause which is manipulated (predictor variable).
Dependent variable: Depends on something (outcome variable). This is measured, but not influenced.
Manifest variable: can be directly observed (e.g., height)
Latent variable: can only be observed indirectly (e.g., intelligence of likeability)
Within the variables, you could assign a variable as missing as well. You can choose either ‘discrete
missing values’ or ‘range plus one optional discrete missing value’. Choose the first one, and assing
different missing values for different ‘errors’ (like not finished, don’t know as answer, etc.).

Measurement levels
Categorial variables: entities are divided into distinct categories.
1. Binary: there are only two categories. An entity can be placed in only one of them.
For example: gender
2. Nominal: there are more than two categories
For example: your favorite color
3. Ordinal: there are more than two categories and these categories have a logical order. This
allows you to say something about the order or equality (but not about the differences
between points on a scale).
For example: first, second, third
Continuous variables: entities get a distinct score
1. Interval: equal intervals on the variable represent equal differences in the property being
measured. This allows you to say something about the distance between units, the order of
things or whether something equals something or not.
Example: value from 1 to 10, or Likert scale.
2. Ratio: equal intervals on the variable represent equal differences in the property being
measured, but the ratios of the scores must also make sense. This is called a meaningful
zero point. The answer can be 0 as well, so there is a meaningful zero point. This allows you
to say something about the ratio between measurements, distance between units and
order of things.
Example: weight in kilograms or calories in a drink
3. Discrete variables: can only take certain values on the scale.
Measurement error: a discrepancy between the numbers we use to represent the thing we’re
measuring and the actual value of the thing we’re measuring. Self-reports are especially prone to
measurement errors (e.g., almost every driver sees himself as a better or average driver).

Coding or grouping variables: numbers are used to represent different groups or categories of data. For
example: men=1, female=2. As such, a coding variable is numeric, but because the numbers represent
names its variable type is nominal. The belonging codes are arbitrary, because the numbers themselves
won’t be analyzed.


3

The benefits of buying summaries with Stuvia:

Guaranteed quality through customer reviews

Guaranteed quality through customer reviews

Stuvia customers have reviewed more than 700,000 summaries. This how you know that you are buying the best documents.

Quick and easy check-out

Quick and easy check-out

You can quickly pay through credit card or Stuvia-credit for the summaries. There is no membership needed.

Focus on what matters

Focus on what matters

Your fellow students write the study notes themselves, which is why the documents are always reliable and up-to-date. This ensures you quickly get to the core!

Frequently asked questions

What do I get when I buy this document?

You get a PDF, available immediately after your purchase. The purchased document is accessible anytime, anywhere and indefinitely through your profile.

Satisfaction guarantee: how does it work?

Our satisfaction guarantee ensures that you always find a study document that suits you well. You fill out a form, and our customer service team takes care of the rest.

Who am I buying these notes from?

Stuvia is a marketplace, so you are not buying this document from us, but from seller tessihengst. Stuvia facilitates payment to the seller.

Will I be stuck with a subscription?

No, you only buy these notes for $7.04. You're not tied to anything after your purchase.

Can Stuvia be trusted?

4.6 stars on Google & Trustpilot (+1000 reviews)

77858 documents were sold in the last 30 days

Founded in 2010, the go-to place to buy study notes for 14 years now

Start selling
$7.04
  • (0)
  Add to cart