GZW1026 Introductie Statistische
Methoden voor Data-analyse
Uitgewerkte statistic clips, colleges en seminars
Jaar 1 Gezondheidswetenschappen/Health Sciences
Academisch jaar 2019-2020
,Inhoud
Uitwerking Statistic Clips 3
Colleges 33
Seminars 69
,Uitwerking Statistic Clips
WEEK 1
1. Bar charts, how to read them
Two column bar graph → for each (for example) student, you have two columns of
data
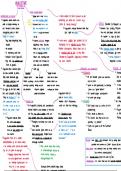
2. Types of variables ‘NOIR’
The higher the level of measurement, the more statistical tests that can be run with
the data. That is why it’s best to use the highest level of measurement.
Levels of measurement from low to high: NOIR:
- Nominal (nom → name, at a nominal level, you are simply naming
categories),
- lowest level of measurement;
- discrete categories (mutually exclusive categories → each category
has a criteria that a variable either has or do not have);
- no natural order (numbers have no meaning, because they are labels);
- categorical (more than two possible values) or dichotomous (one of two
categories);
- may be referred to a qualitative or categorical (not numerical);
- often in bar or pie charts;
- the only measure of central tendency that makes sense with nominal
data is the mode;
Examples: gender, group membership, marital status, colour, religion, type of
car etc.
- Ordinal (or → order);
- also categorial;
- difference between nominal and ordinal: categories have a natural
order to them;
- ordered categories;
- relative rankings;
- unknown distance between rankings;
- zero is arbitrary (willekeurig);
- unknown how much distance between categories, so intervals between
each number are not necessarily equal → values simply express an
order;
- all nominal level tests can be run on ordinal data;
- a median can be calculated in addition to a mode (the mean or average
of ordinal data cannot be calculated because the difference between
the values on the scale is not known);
Examples: Likert scales, socioeconomic status (1 = low, 2 = middle, 3 = high),
size (1 = small, 2 = medium, 3 = large), ranking of favorite sports, class
rankings, wellness rankings, customer satisfaction, movie rankings.
- Interval (interval = space in between);
, - ordered categories, but the intervals are known and equal;
- equal distance, therefore the difference between two values is
meaningful for interval variables;
- an accepted unit of measurement;
- zero is arbitrary, because a score of zero does not actually mean that
the variable does not exist, but zero simply represents an additional
point of measurement;
- with interval level scales, there is a direct, measurable quantity and
zero does not represent the absolute lowest value, but it is a point on
the scale with numbers both above and below it;
- the mean, median and mode and standard deviation can all be
calculated;
- there is no ‘true zero’, so it is impossible to multiply, divide or calculate
ratios;
Examples: school test, temperature, measured in degrees or Fahrenheit.
- Ratio (ratio → O, so there is a zero);
- most precise;
- exact values;
- equal intervals
- ordered with known and measurable intervals between each value
- the zero is absolute/natural zero:
- when the variable equals 0, it means there is none of that
variable;
- not arbitrary;
- only possible with physical measurements like height, weight and
length;
- any statistical test can be used with ratio level data as long as it fits
with the study question and design;
- it is possible to compare amounts of the variable and make a claim that
one is twice as much as the other;
Examples: weight, height, pulse, blood pressure, time, degrees Kelvin.
Characteristics of levels of measurement:
Level of measurement decision tree:
Methoden voor Data-analyse
Uitgewerkte statistic clips, colleges en seminars
Jaar 1 Gezondheidswetenschappen/Health Sciences
Academisch jaar 2019-2020
,Inhoud
Uitwerking Statistic Clips 3
Colleges 33
Seminars 69
,Uitwerking Statistic Clips
WEEK 1
1. Bar charts, how to read them
Two column bar graph → for each (for example) student, you have two columns of
data
2. Types of variables ‘NOIR’
The higher the level of measurement, the more statistical tests that can be run with
the data. That is why it’s best to use the highest level of measurement.
Levels of measurement from low to high: NOIR:
- Nominal (nom → name, at a nominal level, you are simply naming
categories),
- lowest level of measurement;
- discrete categories (mutually exclusive categories → each category
has a criteria that a variable either has or do not have);
- no natural order (numbers have no meaning, because they are labels);
- categorical (more than two possible values) or dichotomous (one of two
categories);
- may be referred to a qualitative or categorical (not numerical);
- often in bar or pie charts;
- the only measure of central tendency that makes sense with nominal
data is the mode;
Examples: gender, group membership, marital status, colour, religion, type of
car etc.
- Ordinal (or → order);
- also categorial;
- difference between nominal and ordinal: categories have a natural
order to them;
- ordered categories;
- relative rankings;
- unknown distance between rankings;
- zero is arbitrary (willekeurig);
- unknown how much distance between categories, so intervals between
each number are not necessarily equal → values simply express an
order;
- all nominal level tests can be run on ordinal data;
- a median can be calculated in addition to a mode (the mean or average
of ordinal data cannot be calculated because the difference between
the values on the scale is not known);
Examples: Likert scales, socioeconomic status (1 = low, 2 = middle, 3 = high),
size (1 = small, 2 = medium, 3 = large), ranking of favorite sports, class
rankings, wellness rankings, customer satisfaction, movie rankings.
- Interval (interval = space in between);
, - ordered categories, but the intervals are known and equal;
- equal distance, therefore the difference between two values is
meaningful for interval variables;
- an accepted unit of measurement;
- zero is arbitrary, because a score of zero does not actually mean that
the variable does not exist, but zero simply represents an additional
point of measurement;
- with interval level scales, there is a direct, measurable quantity and
zero does not represent the absolute lowest value, but it is a point on
the scale with numbers both above and below it;
- the mean, median and mode and standard deviation can all be
calculated;
- there is no ‘true zero’, so it is impossible to multiply, divide or calculate
ratios;
Examples: school test, temperature, measured in degrees or Fahrenheit.
- Ratio (ratio → O, so there is a zero);
- most precise;
- exact values;
- equal intervals
- ordered with known and measurable intervals between each value
- the zero is absolute/natural zero:
- when the variable equals 0, it means there is none of that
variable;
- not arbitrary;
- only possible with physical measurements like height, weight and
length;
- any statistical test can be used with ratio level data as long as it fits
with the study question and design;
- it is possible to compare amounts of the variable and make a claim that
one is twice as much as the other;
Examples: weight, height, pulse, blood pressure, time, degrees Kelvin.
Characteristics of levels of measurement:
Level of measurement decision tree: