UNIT 7: THE FIRM AND ITS CUSTOMERS
HOW A PROFIT-MAXIMIZING FIRM PRODUCING A DIFFERENTIATED PRODUCT INTERACTS WITH
ITS CUSTOMERS
KEY POINTS
• Product demand curve: Tells how many units consumers will buy at each price
• Firm’s marginal cost: The additional cost of making one extra unit of output
• Profit-maximizing point: In markets with differentiated products, each firm chooses its price
and quantity from the feasible set given the demand for its own brand. This is: demand curve
is tangent to highest isoprofit curve
• Deadweight loss: In markets with differentiated products, firms set a price higher than the
marginal costs → not all potential gains from trade are realized
• Impact of demand elasticity on price: In markets with differentiated products, the lower the
elasticity of demand (=steeper demand curve), the higher the firm’s price relative to its
marginal cost, the higher its profit margin, and the higher the deadweight loss.
7.1 BREAKFAST CEREAL: CHOOSING A PRICE
• For a firm to set a price, they need to know the willingness to pay of consumers
• In general: the lower the price, the more consumers wish to buy
• Consider how decisions will affect profits: to maximize profit, is to produce the quantity you
expect to sell, and no more
• Isoprofit curve: Curve that shows same profit for any choice of price and quantity. One is
indifferent between combinations of price and quantity that give same profit.
o The farther from the origin, the higher the profit level
o Slope = Trade-off one is willing to make between P and Q (=the MRS)
• Slope of demand curve: Trade-off one is constrained to make (=MRT).
• 𝑇𝑜𝑡𝑎𝑙 𝑐𝑜𝑠𝑡 = 𝑢𝑛𝑖𝑡 𝑐𝑜𝑠𝑡 ∗ 𝑞𝑢𝑎𝑛𝑡𝑖𝑡𝑦
• 𝑇𝑜𝑡𝑎𝑙 𝑟𝑒𝑣𝑒𝑛𝑢𝑒 = 𝑝𝑟𝑖𝑐𝑒 ∗ 𝑞𝑢𝑎𝑛𝑡𝑖𝑡𝑦
• 𝑃𝑟𝑜𝑓𝑖𝑡 = 𝑡𝑜𝑡𝑎𝑙 𝑟𝑒𝑣𝑒𝑛𝑢𝑒 − 𝑡𝑜𝑡𝑎𝑙 𝑐𝑜𝑠𝑡
7.2 ECONOMIES OF SCALE AND THE COST ADVANTAGES OF LARGE -SCALE PRODUCTION
ECONOMIES OF SCALE, DISECONOMIES OF SCALE AND CONSTANT RETURNS TO SC ALE
• Economies of scale / increasing returns to scale in production: Input increases output >
proportionally
• Diseconomies of scale / decreasing returns to scale in production: Input increases output <
proportionally
1
, o Dilbert law of firm hierarchy: When supervising production workers requires more
than a proportional increase in input of supervisors.
To increase inputs proportionally, the firm should reduce the intensity of supervision,
which correlates to loss of productivity
• Constant returns to scale in production: Input increases output proportionally
ADVANTAGES OF LARGE -SCALE FIRMS
• Large firms can produce its output at a lower cost per unit because of:
o Cost advantages: Ability to purchase input at lower cost due to bargaining power
when negotiating with suppliers
o Economies of scale / increasing returns: Technological advantages: Large-scale
production means often fewer inputs per unit of output.
Result from: Specialization among members of firm / engineering reasons
• Cost per unit falls if output increases (even with constant or decreasing returns to scale) due
to fixed costs (e.g. R&D, marketing expenses, lobbying, contributions to election campaign)
• Network effects: When people are more likely to buy a product/service if it has a lot of users
already. Thus large-scale production increases demand
Limits to firm growth: ‘make it or buy it choice’ when producing components: cheaper to outsource
or manufacture it in house?
7.3 PRODUCTION: THE COST FUNCTION
• Cost function (C(Q)): Total cost in relation to the quantity produced → average cost curve
(AC): Average cost per output
Decreasing average costs at low levels of output (AC curve slopes downward), and increasing
average costs at high levels of output (AC curve slopes upward). Happens because of scaling
(e.g. more numbers of shift on assembly line, pay overtime wages)
o Includes opportunity cost of capital
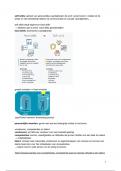
• Marginal cost: The additional cost of producing one more unit of output. Corresponds to the
slope of C(Q).
∆𝐶
𝑀𝐶 = ∆𝑄
• If at the value of Q: [AC > MC: AC slopes downward] and [AC < MC: AC curve slopes upwards]
• Firm’s owners (shareholders) only invest when: profits > opportunity cost of capital
• Economies of scope: Cost savings from producing several products (e.g. producing graduate
education, undergraduate education and research together)
7.4 SETTING THE PRICE FOR DIFFERENTIATED PRODUCTS
DEMAND
2
HOW A PROFIT-MAXIMIZING FIRM PRODUCING A DIFFERENTIATED PRODUCT INTERACTS WITH
ITS CUSTOMERS
KEY POINTS
• Product demand curve: Tells how many units consumers will buy at each price
• Firm’s marginal cost: The additional cost of making one extra unit of output
• Profit-maximizing point: In markets with differentiated products, each firm chooses its price
and quantity from the feasible set given the demand for its own brand. This is: demand curve
is tangent to highest isoprofit curve
• Deadweight loss: In markets with differentiated products, firms set a price higher than the
marginal costs → not all potential gains from trade are realized
• Impact of demand elasticity on price: In markets with differentiated products, the lower the
elasticity of demand (=steeper demand curve), the higher the firm’s price relative to its
marginal cost, the higher its profit margin, and the higher the deadweight loss.
7.1 BREAKFAST CEREAL: CHOOSING A PRICE
• For a firm to set a price, they need to know the willingness to pay of consumers
• In general: the lower the price, the more consumers wish to buy
• Consider how decisions will affect profits: to maximize profit, is to produce the quantity you
expect to sell, and no more
• Isoprofit curve: Curve that shows same profit for any choice of price and quantity. One is
indifferent between combinations of price and quantity that give same profit.
o The farther from the origin, the higher the profit level
o Slope = Trade-off one is willing to make between P and Q (=the MRS)
• Slope of demand curve: Trade-off one is constrained to make (=MRT).
• 𝑇𝑜𝑡𝑎𝑙 𝑐𝑜𝑠𝑡 = 𝑢𝑛𝑖𝑡 𝑐𝑜𝑠𝑡 ∗ 𝑞𝑢𝑎𝑛𝑡𝑖𝑡𝑦
• 𝑇𝑜𝑡𝑎𝑙 𝑟𝑒𝑣𝑒𝑛𝑢𝑒 = 𝑝𝑟𝑖𝑐𝑒 ∗ 𝑞𝑢𝑎𝑛𝑡𝑖𝑡𝑦
• 𝑃𝑟𝑜𝑓𝑖𝑡 = 𝑡𝑜𝑡𝑎𝑙 𝑟𝑒𝑣𝑒𝑛𝑢𝑒 − 𝑡𝑜𝑡𝑎𝑙 𝑐𝑜𝑠𝑡
7.2 ECONOMIES OF SCALE AND THE COST ADVANTAGES OF LARGE -SCALE PRODUCTION
ECONOMIES OF SCALE, DISECONOMIES OF SCALE AND CONSTANT RETURNS TO SC ALE
• Economies of scale / increasing returns to scale in production: Input increases output >
proportionally
• Diseconomies of scale / decreasing returns to scale in production: Input increases output <
proportionally
1
, o Dilbert law of firm hierarchy: When supervising production workers requires more
than a proportional increase in input of supervisors.
To increase inputs proportionally, the firm should reduce the intensity of supervision,
which correlates to loss of productivity
• Constant returns to scale in production: Input increases output proportionally
ADVANTAGES OF LARGE -SCALE FIRMS
• Large firms can produce its output at a lower cost per unit because of:
o Cost advantages: Ability to purchase input at lower cost due to bargaining power
when negotiating with suppliers
o Economies of scale / increasing returns: Technological advantages: Large-scale
production means often fewer inputs per unit of output.
Result from: Specialization among members of firm / engineering reasons
• Cost per unit falls if output increases (even with constant or decreasing returns to scale) due
to fixed costs (e.g. R&D, marketing expenses, lobbying, contributions to election campaign)
• Network effects: When people are more likely to buy a product/service if it has a lot of users
already. Thus large-scale production increases demand
Limits to firm growth: ‘make it or buy it choice’ when producing components: cheaper to outsource
or manufacture it in house?
7.3 PRODUCTION: THE COST FUNCTION
• Cost function (C(Q)): Total cost in relation to the quantity produced → average cost curve
(AC): Average cost per output
Decreasing average costs at low levels of output (AC curve slopes downward), and increasing
average costs at high levels of output (AC curve slopes upward). Happens because of scaling
(e.g. more numbers of shift on assembly line, pay overtime wages)
o Includes opportunity cost of capital
• Marginal cost: The additional cost of producing one more unit of output. Corresponds to the
slope of C(Q).
∆𝐶
𝑀𝐶 = ∆𝑄
• If at the value of Q: [AC > MC: AC slopes downward] and [AC < MC: AC curve slopes upwards]
• Firm’s owners (shareholders) only invest when: profits > opportunity cost of capital
• Economies of scope: Cost savings from producing several products (e.g. producing graduate
education, undergraduate education and research together)
7.4 SETTING THE PRICE FOR DIFFERENTIATED PRODUCTS
DEMAND
2