Summary
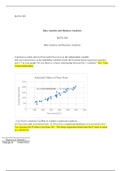
Summary DATA Week 5.docx DATA 565 Data Analysis and Business Analytics DATA 565 Data Analysis and Business Analytics Construct a scatter plot in Excel with FloorArea as the independent variable and AssessmentValue as the dependent variable. Insert the bi
- Course
- University Of Phoenix UoP
- Institution
- University Of Phoenix
DATA Week DATA 565 Data Analysis and Business Analytics DATA 565 Data Analysis and Business Analytics Construct a scatter plot in Excel with FloorArea as the independent variable and AssessmentValue as the dependent variable. Insert the bivariate linear regression equation and r^2 in ...
[Show more]