Microsoft Excel 2019 Data Analysis and Business Modeling notes (6th edition)
Wayne Winston
View all 7 notes for Microsoft Excel 2019 Data Analysis and Business Modeling, written by Wayne Winston. All Microsoft Excel 2019 Data Analysis and Business Modeling notes, flashcards, summaries and study guides are written by your fellow students or tutors. Get yourself a Microsoft Excel 2019 Data Analysis and Business Modeling summary or other study material that matches your study style perfectly, and studying will be a breeze.
Author(s)
Wayne Winston
ISBN
9781509305889
Edition
6
Publisher
Microsoft Press,U.S.
Language
en
All
7 results
Sort by:
Best selling Microsoft Excel 2019 Data Analysis and Business Modeling notes
Explain the measures of central tendency.
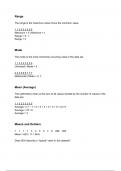
Calculate the mean, median, and mode of a data set.
Calculate the range, quartiles, and interquartile range of a data set.
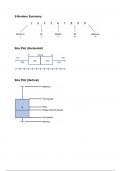
Construct a 5-number summary of a data set.
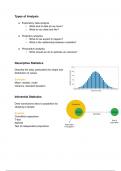
Explain the difference between descriptive and inferential statistics.
Identify the types of data and levels of measurement.
Calculate relative and cumulative frequencies frequencies.
Use pivot tables to explore a new data set.
Construct a box plot to visualize the 5-number of summary of a data set.
Match a frequency distribution to a corresponding box plot.
Calculate the upper and lower fences for outliers using the interquartile range.
Identify outliers using the interquartile range method.
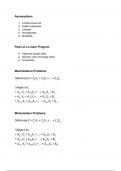
Identify the objective, decision cells, and constraints in an optimization problem.
Set up an optimization problem in Excel.
Set up Solver to solve an optimization problem in Excel.
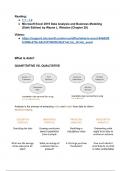
Distinguish between quantitative and qualitative data.
Understand the distinction between different types of statistics and analytics.
Explain how data analysis is used to inform business decision-making.
Identify the primary steps in the data analysis lifecyle.
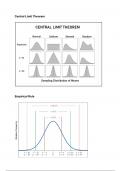
Explain the central limit theorem.
Apply the empirical rule to a normal data set.
Apply Chebychev's theorem to a non-normal data set.
Calculate z-scores for values in a data set.
Identify outliers in a data set using z-scores.
Popular
alexperez
$6.09
More Info
Newest Microsoft Excel 2019 Data Analysis and Business Modeling summaries
Construct a box plot to visualize the 5-number of summary of a data set.
Match a frequency distribution to a corresponding box plot.
Calculate the upper and lower fences for outliers using the interquartile range.
Identify outliers using the interquartile range method.
Explain the measures of central tendency.
Calculate the mean, median, and mode of a data set.
Calculate the range, quartiles, and interquartile range of a data set.
Construct a 5-number summary of a data set.
Identify the objective, decision cells, and constraints in an optimization problem.
Set up an optimization problem in Excel.
Set up Solver to solve an optimization problem in Excel.
Explain the central limit theorem.
Apply the empirical rule to a normal data set.
Apply Chebychev's theorem to a non-normal data set.
Calculate z-scores for values in a data set.
Identify outliers in a data set using z-scores.
Explain the difference between descriptive and inferential statistics.
Identify the types of data and levels of measurement.
Calculate relative and cumulative frequencies frequencies.
Use pivot tables to explore a new data set.
Distinguish between quantitative and qualitative data.
Understand the distinction between different types of statistics and analytics.
Explain how data analysis is used to inform business decision-making.
Identify the primary steps in the data analysis lifecyle.