Package deal
UCF QMB 3200 EXAMS COMPILATION BUNDLE 2024/2025|ALL GRADED A+|FULLY SOLVED |DOWNLOAD TO PASS
UCF QMB 3200 EXAMS COMPILATION BUNDLE 2024/2025|ALL GRADED A+|FULLY SOLVED |DOWNLOAD TO PASS
[Show more]UCF QMB 3200 EXAMS COMPILATION BUNDLE 2024/2025|ALL GRADED A+|FULLY SOLVED |DOWNLOAD TO PASS
[Show more]
QMB 3200 CONCEPTS EXAM 2 UCF QUESTIONS AND ANSWERS 2024
Preview 1 out of 2 pages
Add to cartQMB 3200 CONCEPTS EXAM 2 UCF QUESTIONS AND ANSWERS 2024
residual The difference between the observed value of the dependent variable and the value predicted using the estimated regression equation is called a(n) increase the value of the correlation. Influential observations always: normal probability plot. A graph of the standardized re...
Preview 2 out of 12 pages
Add to cartresidual The difference between the observed value of the dependent variable and the value predicted using the estimated regression equation is called a(n) increase the value of the correlation. Influential observations always: normal probability plot. A graph of the standardized re...
stratified random sampling A form of probability sampling; a random sampling technique in which the researcher identifies particular demographic categories of interest and then randomly selects individuals within each category. Parameter A numerical characteristic of a population, such as a...
Preview 2 out of 11 pages
Add to cartstratified random sampling A form of probability sampling; a random sampling technique in which the researcher identifies particular demographic categories of interest and then randomly selects individuals within each category. Parameter A numerical characteristic of a population, such as a...

IMPORTANT PRACTICE TEST INFORMATION!!!! This may be even more helpful than this quizlet!!!! In mindtap go to the left-hand toolbar, select courses, and select this course. You should see a dashboard with the chapters on the left and your recent homework scores on the right. Then on chapter 1 c...
Preview 4 out of 47 pages
Add to cartIMPORTANT PRACTICE TEST INFORMATION!!!! This may be even more helpful than this quizlet!!!! In mindtap go to the left-hand toolbar, select courses, and select this course. You should see a dashboard with the chapters on the left and your recent homework scores on the right. Then on chapter 1 c...
Discrete Data Values are whole numbers (integers) -Usually counted, not measured Continuous Data Can potentially take on any value, depending only on the ability to measure accurately -Often measured, fractional values are possible Discrete Random Variables have outcomes that typi...
Preview 2 out of 9 pages
Add to cartDiscrete Data Values are whole numbers (integers) -Usually counted, not measured Continuous Data Can potentially take on any value, depending only on the ability to measure accurately -Often measured, fractional values are possible Discrete Random Variables have outcomes that typi...

Analytics is the scientific process of transforming data for decision making. There are three broad areas of data analytics. Descriptive Analytics which describes what has happened in the past. Predictive Analytics uses statistical models from past data to predict the future [foreca...
Preview 1 out of 4 pages
Add to cartAnalytics is the scientific process of transforming data for decision making. There are three broad areas of data analytics. Descriptive Analytics which describes what has happened in the past. Predictive Analytics uses statistical models from past data to predict the future [foreca...
What is a sample space the set of all possible outcomes outcome is the result of the experiment What is a trial Repetitionfrom a random experiment Random experiment Has outcomesthat we cannot predict Experiments involvechanceor random results Probability Refers to a numb...
Preview 1 out of 2 pages
Add to cartWhat is a sample space the set of all possible outcomes outcome is the result of the experiment What is a trial Repetitionfrom a random experiment Random experiment Has outcomesthat we cannot predict Experiments involvechanceor random results Probability Refers to a numb...
1x sold
If the confidence interval for the regression slope includes zero, we would have some evidence that beta could be equal to zero, which would indicate that there may not be a relationship between the dependent and independent variables. True A professor would like to test the hypothesi...
Preview 1 out of 4 pages
Add to cartIf the confidence interval for the regression slope includes zero, we would have some evidence that beta could be equal to zero, which would indicate that there may not be a relationship between the dependent and independent variables. True A professor would like to test the hypothesi...
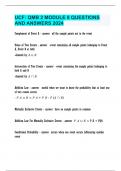
A survey of 800 college seniors resulted in the following crosstabulation regarding their undergraduate major and their plan of going to graduate school. According to the crosstabulation above, what percent of undergraduate majors plan to go to graduate school? 65.0% 19.3% 27.8% 35.0% 35.0% ...
Preview 3 out of 18 pages
Add to cartA survey of 800 college seniors resulted in the following crosstabulation regarding their undergraduate major and their plan of going to graduate school. According to the crosstabulation above, what percent of undergraduate majors plan to go to graduate school? 65.0% 19.3% 27.8% 35.0% 35.0% ...
The difference between the actual time series value and the forecast is called: forecast error. In the linear trend equation, Tt = b0 + b1t, b0 represents the: y- intercept of the trend line. The time series model that is appropriate in situations where the seasonal fluctuations do n...
Preview 3 out of 22 pages
Add to cartThe difference between the actual time series value and the forecast is called: forecast error. In the linear trend equation, Tt = b0 + b1t, b0 represents the: y- intercept of the trend line. The time series model that is appropriate in situations where the seasonal fluctuations do n...

The difference between the actual time series value and the forecast is called: forecast error. In the linear trend equation, Tt = b0 + b1t, b0 represents the: y- intercept of the trend line. The time series model that is appropriate in situations where the seasonal fluctuations do n...
Preview 2 out of 5 pages
Add to cartThe difference between the actual time series value and the forecast is called: forecast error. In the linear trend equation, Tt = b0 + b1t, b0 represents the: y- intercept of the trend line. The time series model that is appropriate in situations where the seasonal fluctuations do n...
Mean average value for a variable Sample Mean denoted as
Preview 1 out of 2 pages
Add to cartMean average value for a variable Sample Mean denoted as
Complement of Event A all the sample points not in the event Union of Two Events -event containing all sample points belonging to Event A, Event B or both -denoted by
Preview 1 out of 2 pages
Add to cartComplement of Event A all the sample points not in the event Union of Two Events -event containing all sample points belonging to Event A, Event B or both -denoted by

Addition law A probability law used to compute the probability of the union of two events. It is P(A ∩ B) = P(A) + P(B) − P(A ∪ B). For mutually exclusive events, P(A ∩ B) = 0; in this case the addition law reduces to P(A ∪ B) = P(A) + P(B). Basic requirements for assigning pro...
Preview 1 out of 4 pages
Add to cartAddition law A probability law used to compute the probability of the union of two events. It is P(A ∩ B) = P(A) + P(B) − P(A ∪ B). For mutually exclusive events, P(A ∩ B) = 0; in this case the addition law reduces to P(A ∪ B) = P(A) + P(B). Basic requirements for assigning pro...
Suppose a political party wants to estimate how favorable a certain candidate is to state voters. To do so, a sample of 400 registered voters were selected. Suppose 160 found the candidate "favorable". An estimate of the proportion of the population of registered voters is 160/400=40%. This is an ...
Preview 3 out of 19 pages
Add to cartSuppose a political party wants to estimate how favorable a certain candidate is to state voters. To do so, a sample of 400 registered voters were selected. Suppose 160 found the candidate "favorable". An estimate of the proportion of the population of registered voters is 160/400=40%. This is an ...
If an interval estimate is said to be constructed at the 90% confidence level, the confidence coefficient would be _____. 0.9 (90%) The mean of the t distribution is _____. zero (0) The use of the normal probability distribution as an approximation of the sampling distribution of p̄...
Preview 2 out of 5 pages
Add to cartIf an interval estimate is said to be constructed at the 90% confidence level, the confidence coefficient would be _____. 0.9 (90%) The mean of the t distribution is _____. zero (0) The use of the normal probability distribution as an approximation of the sampling distribution of p̄...

7x sold
Data the facts & figures collected, analyzed, and summarized for presentation and interpretation Dataset all the data collected for a particular analysis Element the entity on which data is collected Variable a characteristic of interest of an element Observation the...
Preview 2 out of 8 pages
Add to cartData the facts & figures collected, analyzed, and summarized for presentation and interpretation Dataset all the data collected for a particular analysis Element the entity on which data is collected Variable a characteristic of interest of an element Observation the...
The central limit theorem is important in Statistics because it: enables reasonably accurate probabilities to be determined for events involving the sample average when the sample size is large regardless of the distribution of the variable. A simple random sample of size n from an infinite ...
Preview 2 out of 6 pages
Add to cartThe central limit theorem is important in Statistics because it: enables reasonably accurate probabilities to be determined for events involving the sample average when the sample size is large regardless of the distribution of the variable. A simple random sample of size n from an infinite ...
QMB 3200 Test #2 UCF questions and answers 2024
Preview 2 out of 9 pages
Add to cartQMB 3200 Test #2 UCF questions and answers 2024
n Which of the following symbols represents the size of a sample? 8 The variance of a sample of 81 observations is 64. The standard deviation of the sample is which of the following? computed by summing all the data values and dividing the sum by the number of items The mean of a sa...
Preview 2 out of 13 pages
Add to cartn Which of the following symbols represents the size of a sample? 8 The variance of a sample of 81 observations is 64. The standard deviation of the sample is which of the following? computed by summing all the data values and dividing the sum by the number of items The mean of a sa...
In a multiple regression model, the value of the error term,E, are assumes to be independent of each other In regression analysis, the response variable is the dependent variable A measure of goodness of fit for the estimated regression equation is the Multiple coefficient of determ...
Preview 2 out of 6 pages
Add to cartIn a multiple regression model, the value of the error term,E, are assumes to be independent of each other In regression analysis, the response variable is the dependent variable A measure of goodness of fit for the estimated regression equation is the Multiple coefficient of determ...
Autocorrelation Correlation in the errors that arises when the error terms at successive points in time are related. Durbin-Watson test A test to determine whether first-order autocorrelation is present. General linear model A model of the form y=β0+β1z1+β2z2+⋯+βpzp+ε, where ...
Preview 3 out of 21 pages
Add to cartAutocorrelation Correlation in the errors that arises when the error terms at successive points in time are related. Durbin-Watson test A test to determine whether first-order autocorrelation is present. General linear model A model of the form y=β0+β1z1+β2z2+⋯+βpzp+ε, where ...

frequency formula =countif(range,criteria) percent frequency formula =(frequency cell)/sum(range) you need frequency and the total frequencies relative frequency =(frequency cell)/(total cell) you need the frequency and the total Histogram a visual display of a frequen...
Preview 1 out of 3 pages
Add to cartfrequency formula =countif(range,criteria) percent frequency formula =(frequency cell)/sum(range) you need frequency and the total frequencies relative frequency =(frequency cell)/(total cell) you need the frequency and the total Histogram a visual display of a frequen...
Analytics is the scientific process of transforming data for decision making. There are three broad areas of data analytics. Descriptive Analytics which describes what has happened in the past. Predictive Analytics uses statistical models from past data to predict the future [foreca...
Preview 1 out of 4 pages
Add to cartAnalytics is the scientific process of transforming data for decision making. There are three broad areas of data analytics. Descriptive Analytics which describes what has happened in the past. Predictive Analytics uses statistical models from past data to predict the future [foreca...

Stage One: Clarify the Research Question Identify and Prioritize Management Dilemma(s) -Cross-reference Key Performance Indicators Exploration -Define plausible management actions to address dilemma(s) Value and Budget of Research Stage Two: Design the Research Project Data -...
Preview 2 out of 9 pages
Add to cartStage One: Clarify the Research Question Identify and Prioritize Management Dilemma(s) -Cross-reference Key Performance Indicators Exploration -Define plausible management actions to address dilemma(s) Value and Budget of Research Stage Two: Design the Research Project Data -...
General Linear Model A model of the form y=β0+β1z1+β2z2+⋯+βpzp+ε, where each of the independent variables zj(j=1,2,...,p) is a function of x1,x2,...,xk, the variables for which data have been collected. interaction the effect of two independent variable acting together variabl...
Preview 2 out of 5 pages
Add to cartGeneral Linear Model A model of the form y=β0+β1z1+β2z2+⋯+βpzp+ε, where each of the independent variables zj(j=1,2,...,p) is a function of x1,x2,...,xk, the variables for which data have been collected. interaction the effect of two independent variable acting together variabl...

Stuvia customers have reviewed more than 700,000 summaries. This how you know that you are buying the best documents.

You can quickly pay through credit card or Stuvia-credit for the summaries. There is no membership needed.

Your fellow students write the study notes themselves, which is why the documents are always reliable and up-to-date. This ensures you quickly get to the core!
You get a PDF, available immediately after your purchase. The purchased document is accessible anytime, anywhere and indefinitely through your profile.
Our satisfaction guarantee ensures that you always find a study document that suits you well. You fill out a form, and our customer service team takes care of the rest.
Stuvia is a marketplace, so you are not buying this document from us, but from seller BRAINBOOSTERS. Stuvia facilitates payment to the seller.
No, you only buy these notes for $51.49. You're not tied to anything after your purchase.
4.6 stars on Google & Trustpilot (+1000 reviews)
65823 documents were sold in the last 30 days
Founded in 2010, the go-to place to buy study notes for 15 years now