Package deal
QMB 3200 COMPILED REVISION MATERIALS
THIS PACKAGE COMPRISES OF GOOD SIMPLIFIED SUMMARIES AND EXAM QUESTIONS WITH THEIR PROVED CORRECT ANSWERS WHICH ARE BENEFICIAL TO ALL STUDENTS WHO WANT TO PASS THEIR EXAMS
[Show more]THIS PACKAGE COMPRISES OF GOOD SIMPLIFIED SUMMARIES AND EXAM QUESTIONS WITH THEIR PROVED CORRECT ANSWERS WHICH ARE BENEFICIAL TO ALL STUDENTS WHO WANT TO PASS THEIR EXAMS
[Show more]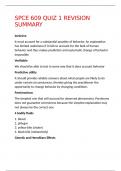
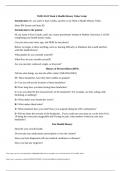
Inclusive It must account for a substantial quantity of behavior. An explanation has limited usefulness if it fails to account for the bulk of human behavior and thus makes prediction and systematic change of behavior impossible Verifiable We should be able to test in some way that it does accoun...
Preview 2 out of 14 pages
Add to cartInclusive It must account for a substantial quantity of behavior. An explanation has limited usefulness if it fails to account for the bulk of human behavior and thus makes prediction and systematic change of behavior impossible Verifiable We should be able to test in some way that it does accoun...
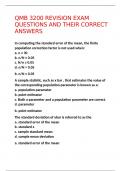
In computing the standard error of the mean, the finite population correction factor is not used when: a. n ≥ 30 b. n/N ≤ 0.05 c. N/n ≤ 0.05 d. n/N > 0.05 b. n/N ≤ 0.05 A sample statistic, such as x bar , that estimates the value of the corresponding population parameter is known as...
Preview 4 out of 32 pages
Add to cartIn computing the standard error of the mean, the finite population correction factor is not used when: a. n ≥ 30 b. n/N ≤ 0.05 c. N/n ≤ 0.05 d. n/N > 0.05 b. n/N ≤ 0.05 A sample statistic, such as x bar , that estimates the value of the corresponding population parameter is known as...
Excel's __________ can be used to construct a crosstabulation. a. COUNTIF function b. PivotTable Report c.Chart Tools d.SUM function B The sum of the percent frequencies for all classes will always equal number of items in the study b.100 number of classes B Excel...
Preview 4 out of 56 pages
Add to cartExcel's __________ can be used to construct a crosstabulation. a. COUNTIF function b. PivotTable Report c.Chart Tools d.SUM function B The sum of the percent frequencies for all classes will always equal number of items in the study b.100 number of classes B Excel...
The standard deviation of a point estimator is the standard error Cluster sampling is a probability sampling method The interquartile range is the difference between the first and third quartiles A __________ can be used to graphically present quantitative data. both a histogram and a stem-an...
Preview 2 out of 13 pages
Add to cartThe standard deviation of a point estimator is the standard error Cluster sampling is a probability sampling method The interquartile range is the difference between the first and third quartiles A __________ can be used to graphically present quantitative data. both a histogram and a stem-an...
The standard deviation of a point estimator is the _____. standard error As the sample size increases, the _____. standard error of the mean decreases The standard deviation of p̄ is referred to as the _____. standard error of the proportion The value of the ___________ is used to estimate th...
Preview 2 out of 10 pages
Add to cartThe standard deviation of a point estimator is the _____. standard error As the sample size increases, the _____. standard error of the mean decreases The standard deviation of p̄ is referred to as the _____. standard error of the proportion The value of the ___________ is used to estimate th...
Data The facts & figures collected, analyzed, and summarized for presentation and interpretation. Dataset All the data collected in a particular study. Element The entity on which data is collected (Think each individual nation) Variable A characteristic of interest of an element(Think GDP or...
Preview 2 out of 12 pages
Add to cartData The facts & figures collected, analyzed, and summarized for presentation and interpretation. Dataset All the data collected in a particular study. Element The entity on which data is collected (Think each individual nation) Variable A characteristic of interest of an element(Think GDP or...
______ data has the benefit of a true zero point ratio a method of gathering data when subjects are exposed to certain treatments and the data of interest is recorded is known as ______ experiments collecting data about the television viewers for the Summer Olympics is an example of using statis...
Preview 2 out of 10 pages
Add to cart______ data has the benefit of a true zero point ratio a method of gathering data when subjects are exposed to certain treatments and the data of interest is recorded is known as ______ experiments collecting data about the television viewers for the Summer Olympics is an example of using statis...
Statistics the mathematical science that deals with the collection, analysis, and presentation of data, which can be used for inference marketing research focus groups, customer surveys, predicting consumer buying patterns advertising household surveys, tv viewing habits operations quality co...
Preview 3 out of 21 pages
Add to cartStatistics the mathematical science that deals with the collection, analysis, and presentation of data, which can be used for inference marketing research focus groups, customer surveys, predicting consumer buying patterns advertising household surveys, tv viewing habits operations quality co...
Which of the following statements regarding a time series technique is true? Time series techniques focus on the historical behavior of some outcome of interest to predict its future behavior. Which time series technique predicts a future value by combining the previous prediction and some portion...
Preview 2 out of 8 pages
Add to cartWhich of the following statements regarding a time series technique is true? Time series techniques focus on the historical behavior of some outcome of interest to predict its future behavior. Which time series technique predicts a future value by combining the previous prediction and some portion...
data the facts & figures collected, analyzed, & summarized for presentation & interpretation dataset all the data collected for a particular analysis element the entity on which data is collected variable a characteristic of interest of an element observation the variables associated with a...
Preview 2 out of 12 pages
Add to cartdata the facts & figures collected, analyzed, & summarized for presentation & interpretation dataset all the data collected for a particular analysis element the entity on which data is collected variable a characteristic of interest of an element observation the variables associated with a...
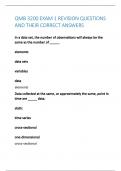
In a data set, the number of observations will always be the same as the number of _____. elements data sets variables data elements Data collected at the same, or approximately the same, point in time are _____ data. static time series cross-sectional one-dimensional cros...
Preview 3 out of 18 pages
Add to cartIn a data set, the number of observations will always be the same as the number of _____. elements data sets variables data elements Data collected at the same, or approximately the same, point in time are _____ data. static time series cross-sectional one-dimensional cros...

Dataset all the data collected for a particular analysis. Element the entity on which data is collected. Variable a characteristic of interest of an element. Observation the variables associated with an individual element. Categorical use numeric or ordinal values of measurement of categori...
Preview 3 out of 19 pages
Add to cartDataset all the data collected for a particular analysis. Element the entity on which data is collected. Variable a characteristic of interest of an element. Observation the variables associated with an individual element. Categorical use numeric or ordinal values of measurement of categori...
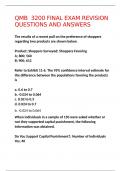
The results of a recent poll on the preference of shoppers regarding two products are shown below. Product; Shoppers Surveyed; Shoppers Favoring A; 800; 560 B; 900; 612 Refer to Exhibit 11-6. The 95% confidence interval estimate for the difference between the populations favoring the product...
Preview 3 out of 23 pages
Add to cartThe results of a recent poll on the preference of shoppers regarding two products are shown below. Product; Shoppers Surveyed; Shoppers Favoring A; 800; 560 B; 900; 612 Refer to Exhibit 11-6. The 95% confidence interval estimate for the difference between the populations favoring the product...
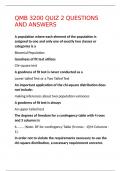
A population where each element of the population is assigned to one and only one of exactly two classes or categories is a Binomial Population Goodness of fit test utilizes Chi-square test A goodness of fit test is never conducted as a Lower tailed Test or a Two Tailed Test An important appli...
Preview 3 out of 20 pages
Add to cartA population where each element of the population is assigned to one and only one of exactly two classes or categories is a Binomial Population Goodness of fit test utilizes Chi-square test A goodness of fit test is never conducted as a Lower tailed Test or a Two Tailed Test An important appli...
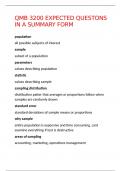
population all possible subjects of interest sample subset of a population parameters values describing population statistic values describing sample sampling distribution distribution patter that averages or proportions follow when samples are randomly drawn standard error standard devia...
Preview 2 out of 9 pages
Add to cartpopulation all possible subjects of interest sample subset of a population parameters values describing population statistic values describing sample sampling distribution distribution patter that averages or proportions follow when samples are randomly drawn standard error standard devia...
Following is a portion of the computer output for a regression analysis relating y = number of people who use the public pool to x = the outside temperature. Predictor Coef Constant 57.912 Temp 0.81138 Predict approximately how many people will use the public pool in a day when the temperatu...
Preview 3 out of 28 pages
Add to cartFollowing is a portion of the computer output for a regression analysis relating y = number of people who use the public pool to x = the outside temperature. Predictor Coef Constant 57.912 Temp 0.81138 Predict approximately how many people will use the public pool in a day when the temperatu...
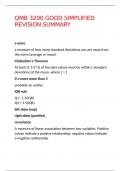
z-score a measure of how many standard deviations you are away from the norm (average or mean) Chebyshev's Theorem At least (1-1/z^2) of the data values must be within z standard deviations of the mean, where z > 1 if z-score more than 3 probably an outlier IQR rule Q1 - 1.5(IQR) Q3 + ...
Preview 2 out of 10 pages
Add to cartz-score a measure of how many standard deviations you are away from the norm (average or mean) Chebyshev's Theorem At least (1-1/z^2) of the data values must be within z standard deviations of the mean, where z > 1 if z-score more than 3 probably an outlier IQR rule Q1 - 1.5(IQR) Q3 + ...
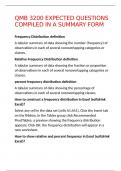
Frequency Distribution definition A tabular summary of data showing the number (frequency) of observations in each of several nonoverlapping categories or classes. Relative Frequency Distribution definition A tabular summary of data showing the fraction or proportion of observations in each of se...
Preview 3 out of 20 pages
Add to cartFrequency Distribution definition A tabular summary of data showing the number (frequency) of observations in each of several nonoverlapping categories or classes. Relative Frequency Distribution definition A tabular summary of data showing the fraction or proportion of observations in each of se...
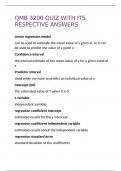
Linear regression model can be used to estimate the mean value of y given xi, or it can be used to predict the value of y given n Confidence interval the interval estimate of the mean value of y for a given value of x Predictor interval Used when we want to predict an individual value of y Int...
Preview 2 out of 7 pages
Add to cartLinear regression model can be used to estimate the mean value of y given xi, or it can be used to predict the value of y given n Confidence interval the interval estimate of the mean value of y for a given value of x Predictor interval Used when we want to predict an individual value of y Int...
What is the z score formula? (the observation - mean) / standard deviation What does a z score tell us? how many standard deviations a value of from the mean How do you find the range? biggest value minus smallest value What is the formula used in excel to find the range? =max(array) - min (a...
Preview 3 out of 18 pages
Add to cartWhat is the z score formula? (the observation - mean) / standard deviation What does a z score tell us? how many standard deviations a value of from the mean How do you find the range? biggest value minus smallest value What is the formula used in excel to find the range? =max(array) - min (a...
If the confidence interval for the regression slope includes zero, we would have some evidence that beta could be equal to zero, which would indicate that there may not be a relationship between the dependent and independent variables. True A professor would like to test the hypothesis that the a...
Preview 3 out of 30 pages
Add to cartIf the confidence interval for the regression slope includes zero, we would have some evidence that beta could be equal to zero, which would indicate that there may not be a relationship between the dependent and independent variables. True A professor would like to test the hypothesis that the a...
If a penny is tossed four times and comes up heads all four times, the probability of heads on the fifth trial is a. zero b. 1/32 c. 0.5 d. larger than the probability of trials 0.5 An experiment consists of four outcomes with P(E1)=0.2, P(E2)=0.3, and P(E3)=0.4. The probability of outcome E4 ...
Preview 4 out of 80 pages
Add to cartIf a penny is tossed four times and comes up heads all four times, the probability of heads on the fifth trial is a. zero b. 1/32 c. 0.5 d. larger than the probability of trials 0.5 An experiment consists of four outcomes with P(E1)=0.2, P(E2)=0.3, and P(E3)=0.4. The probability of outcome E4 ...

CH. 1 Lime Company Total equity + total liabilities CH. 1 Grapefruit servies (Total Assets - Total Liabilities) + (Revenues - Expenses) - owner withdraw CH. 1 Lemon Company, Follow the reports. Mar. 1 The business received $9000 cash from the owner of the business, Lemon. The business gave cap...
Preview 2 out of 13 pages
Add to cartCH. 1 Lime Company Total equity + total liabilities CH. 1 Grapefruit servies (Total Assets - Total Liabilities) + (Revenues - Expenses) - owner withdraw CH. 1 Lemon Company, Follow the reports. Mar. 1 The business received $9000 cash from the owner of the business, Lemon. The business gave cap...
If a residual plot of x versus the residuals, y - ŷ, shows a non-linear pattern, then we should conclude that: A. the regression model was not based upon a large enough sample size. B. the regression model is useful for making predictions. C. the regression model is not an adequate representatio...
Preview 4 out of 37 pages
Add to cartIf a residual plot of x versus the residuals, y - ŷ, shows a non-linear pattern, then we should conclude that: A. the regression model was not based upon a large enough sample size. B. the regression model is useful for making predictions. C. the regression model is not an adequate representatio...
Recently, FHA mortgages, which are insured by the federal government, accounted for 28% of all home-purchase mortgages that were approved. A random sample of 150 mortgage applications was selected. What is the probability that 48 or more from this sample were insured by the FHA? 0.1376 Soffritto I...
Preview 4 out of 43 pages
Add to cartRecently, FHA mortgages, which are insured by the federal government, accounted for 28% of all home-purchase mortgages that were approved. A random sample of 150 mortgage applications was selected. What is the probability that 48 or more from this sample were insured by the FHA? 0.1376 Soffritto I...
Find z the area to the left of Z ex: z = .2119 use row and column area = -.80 Find z area between z values ex: area between -z and z is .9030 divide z by 2 then add .5. Then use z table to find area. .9030/2=.4515+.5=.9515 .9515 in z table is z=1.66 Find z area right of z ex: area right of...
Preview 4 out of 42 pages
Add to cartFind z the area to the left of Z ex: z = .2119 use row and column area = -.80 Find z area between z values ex: area between -z and z is .9030 divide z by 2 then add .5. Then use z table to find area. .9030/2=.4515+.5=.9515 .9515 in z table is z=1.66 Find z area right of z ex: area right of...

Stuvia customers have reviewed more than 700,000 summaries. This how you know that you are buying the best documents.

You can quickly pay through credit card or Stuvia-credit for the summaries. There is no membership needed.

Your fellow students write the study notes themselves, which is why the documents are always reliable and up-to-date. This ensures you quickly get to the core!
You get a PDF, available immediately after your purchase. The purchased document is accessible anytime, anywhere and indefinitely through your profile.
Our satisfaction guarantee ensures that you always find a study document that suits you well. You fill out a form, and our customer service team takes care of the rest.
Stuvia is a marketplace, so you are not buying this document from us, but from seller AcademicSuperStore. Stuvia facilitates payment to the seller.
No, you only buy these notes for $84.07. You're not tied to anything after your purchase.
4.6 stars on Google & Trustpilot (+1000 reviews)
65040 documents were sold in the last 30 days
Founded in 2010, the go-to place to buy study notes for 15 years now