Psychology Research (PYC 3704)
Feedback on previous examination papers (2011 – 2014)
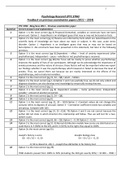
PYC 3704 - May/June 2011 – Previous examination paper
Question Correct answers and explanations
1 Option 1 is the most correct (pg 4).Proposed (tentative), variables or constructs have not been
proven yet. Option 2 - Hypothesis is an intelligent guess that may or may not be based on facts.
2 Option 2 is the most correct (pg 4).Theories are informed by facts which are tested based on the
scientific body of knowledge we have about our topic or subject, in this case, acute stress
disorder. Option 1 -Hypothesis is an intelligent guess that may or may not be based on
facts.Option 3 –No constructs have been presented in this statement, but later in the following
premises.
3 Option 3 is the most correct (pg 8).Dependent – effect – level of anxiety experienced (after
psychotherapy). Independent – cause – whether or not psychotherapy is received.
4 Option 1 is the most correct (pg 60).Our focus will be mainly to prove whether psychotherapy
improves the quality of lives of our participants. Although we do acknowledge the importance of
anxiety proneness and the nature of stressor, these factors will not be important when we report
our findings whether it was the psychotherapy which lowered or failed to decrease the level of
anxiety. Thus, we cancel them out because we are mainly interested on the effects of the
psychotherapy, and not external variables.
5 Option 3 is the most correct (pg 21, 24 – Q8). Latent – hidden.
6 Option 2 is the most correct (pg 1-2).Option 1 and 2 are partially true, we do not only collect and
diagnose disorders; we also develop new knowledge by empirically testing theories.
7 Option 2 is the most correct (pg 1).
8 Option 3 is the most correct (pg 8). Dependent variable – motor performance. Independent
variable – amount of alcohol consumed.
9 Option 2 is the most correct (pg 21, 24 – Q8).
10 Option 1 is the most correct (pg 8).
11 Option 1 is the most correct (pg 22, 24 – Q10).Option 2 –Constant values do not change (the
scenario refers to degrees of arousal). Option 3 – Correlation coefficient needs two variables and
one group. Compare with Q25.
12 Option 1 is the most correct (pg 23, 25 –Q18, 75).Option 2 and 3 are not correct because the
author did not state in which direction the relationship will follow. Thus we will test for a two-
tailed t-score.
13 Option 3 is the most correct (pg 63, 66 – Q5).Option 1 – 0, 99 Option 2 – 0, 00.
14 Option 2 is the most correct (pg 51-3).Normal distribution models how scores are distributed on a
scale that is 0, 5 (50%) to the left, and 0, 5 (50 %) to the right, thus equal to 100%.
15 Option 2is the most correct (pg 55).
Joseph’s history z-score Josephs biology class
60 - = - 0, 50 50 – = - 0, 25
-0, 50 is closest to –00, 1 – Joseph thus did better in his history test
16 Option 3 is the most correct (pg 29).
7000 students passed from 100% to 50% (including the 300 got exactly 50%) = 10 000 – 7000 =
, 2
3000 failed
000 x 100 = 0, 3
17 Option 1 is the most correct (pg 52).
18 Option 3 is the most correct (pg 61).Sample means is equal to population mean (all possible
samples in the population.
19 Option 3 is the most correct (pg 29).
20 Option 1 is the most correct (pg 29).
21 Option 3 is the most correct (pg 29).
= 0, 33
22 Option 3 is the most correct (pg 60-1).
Two important elements you need to note on the central limit theorem:
(a) “This theorem gives the sample distribution of the sample means for any population,
irrespective of the shape, mean or standard deviation of the original population.”
(b) “The distribution of sample means (equal to population mean) will become more normal
as sample size (n) increases.
23 Option 3 is the most correct.
p > 0, 5 = > 50 %
24 Option 1 is the most correct.
450 – 150 = 300
= 0, 0666 = 0, 67
25 Option 1 is the most correct (pg 75).
Null hypothesis: Ho = 0
Alternative hypothesis: Ho: < 7
26 Option 3 is the most correct (pg 75).
• Directional <> (one-tailed)
• Non-directional ≠ (two-tailed)
27 Option 3 is the most correct (pg 78, 82).
28 Option 1 is the most correct (pg 83).
• Type 1 error – p-value smaller than chosen level of significance – thus do not reject
alternative hypothesis (remember that we never accept the alternative because of
possible error).
• Type 2 error – p-value larger than the chosen level of significance – thus do not accept
alternative hypothesis because it is true (do not be misled by the terminology).
29 Option 1 is the most correct (pg 78, 82). We always are trying to disprove the null since null states
the constant variable (no difference exists).
30 Option 2 is the most correct (pg 75).
, 3
• Non-directional hypothesis (≠) requires two-tailed statistical test
• Directional hypothesis (<>) requires one-tailed statistical test
31 Option 1 is the most correct (pg 84).We wrongly reject the null because due to the error involved
in testing probabilities, there is a possibility that it might be true.
32 Option 1 is the most correct (pg 83).
33 Option 3 is the most correct (pg 78). Probabilities figures are based on chance factors, e.g. the
possibility that you will win the next lotto draw is based on chance.
34 Option 1 is the most correct (pg 75).
Type one error – p-value is smaller than the chosen level of significance (do not reject alternative
hypothesis). Thus, the sample result is under the alternative hypothesis.
35 Option 3 is the most correct (pg 18).
• Dependent variable (effect) – Attitude towards abortion (do I favor abortion or not)
• Independent variable (cause) – Extroversion (characterized by sociability, unreserved and
open to new ideas and experiences) (my level of extroversion will affect my attitude
towards abortion).
36 Option 3 is the most correct (pg 11, 124, 127 – Q2).Our target or research population will consist
of women who completed the EPQ test, i.e. we only want to know how these women’s view differ
and not concerned with the entire population. The women in our sample may not reflect the
demographics of all women in the world.
37 Option 2 is the most correct (pg 19). The research hypothesis will give an indication of the
direction of the alternative hypothesis.
38 Option 1 is the most correct (pg 85-6).“The ability of a statistical test to detect a significant
relationship between variables when such a relationship does in fact exist is referred to as its
power.” Power thus supports type-one error (rejection of the null hypothesis) since we did prove
a difference does in fact exist. Remember that the null states a constant value implying there is
no difference between your variables. Sampling errors and errors of measurement reduce our
ability to claim (as reflected in the direction of the alternative hypothesis) that a relationship does
exist.
39 Option 1 is the most correct (pg 116).
40 Option 2 is the most correct (pg 78).We use the test statistic when consulting Appendix D.
41 Option 2 is the most correct (pg 85).Type-two error – reject alternative hypothesis, p-value (0, 06)
is larger than chosen level of significance (0, 05). Alpha gives exact probability of Type-two error.
42 Option 1 is the most correct (pg 85).Type-one error – reject null hypothesis, p-value (0, 04) is
smaller than chosen level of significance (0, 05). P-value gives exact probability of Type-two error.
43 Option 1 is the most correct (pg 81).The null hypothesis (given variable) is assumed to be true
since this is the value indicated by the parameter. The alternative hypothesis (measure we test
using a sample) is indicated by the sample statistic.
44 Option 3 is the most correct (pg 85).
Type one error – p-value is smaller than the chosen level of significance (do not reject alternative
hypothesis).
Type-two error – reject alternative hypothesis - p-value (0, 090) is larger than chosen level of
significance (0, 05).
, 4
45 Option 3 is the most correct (pg 101). Only one group is being sampled.
46 Option 1 is the most correct (pg 75).
Alternative predicts majority of 70 year olds are female (H1 = >).
47 Option 1 is the most correct.
Equal opportunity = x 0, 5
= 0, 3
Bias = 15 x 0,
= 0, 18
Please note that you will not be asked question on the Zp calculation.
48 Option 1 is the most correct. Use Zp value to compare with the standard normal distribution table
(Appendix D) small area (H1 = 0, 7 >).
49 Option 3 is the most correct (pg 61). Standard deviation of the population.
50 Option 2 is the most correct (pg 75).
Converting two-tailed p-value to one-tailed p-value: = 0, 0173
51 Option 3 is the most correct (pg 11, 124, 127). Our target or research population will consist of
depressed patients that could have undergone psychotherapy, i.e. we only want to know if these
individual’s decreased after psychotherapy and not concerned with the entire population. The
patients in our sample may not reflect the demographics of all patients in the world.
52 Option 2 is the most correct (pg 83).
U1 (null hypothesis)
U2 (alternative hypothesis)
53 Option 2 is the most correct (pg 75, 83, 114).
Null always remain constant (no statistical difference).
54 Option 1 is the most correct (pg 177). Appendix F.
One group was sampled and population standard deviation (σ) was given.
55 Option 3 is the most correct (pg 106). We already know there is going to be a statistical difference
that favors the null (Type two error) since p-value is larger than chosen significant value.
56 Option 1 is the most correct (pg 112).
Independent group (individuals are do not share similar characteristics).
57 Option 1 is the most correct (pg 114).
58 Option 3 is the most correct (pg 112).
Zc-statistic mainly gives you the value to be compared with p-value on your tables for both
dependent and independent groups.
59 Option 3 is the most correct (pg 112).
Option 1 (schoolchildren are similar across concerned demographics).
Option 2 ((same individuals with the same characteristics tested before and after).
The benefits of buying summaries with Stuvia:
Guaranteed quality through customer reviews
Stuvia customers have reviewed more than 700,000 summaries. This how you know that you are buying the best documents.
Quick and easy check-out
You can quickly pay through credit card or Stuvia-credit for the summaries. There is no membership needed.
Focus on what matters
Your fellow students write the study notes themselves, which is why the documents are always reliable and up-to-date. This ensures you quickly get to the core!
Frequently asked questions
What do I get when I buy this document?
You get a PDF, available immediately after your purchase. The purchased document is accessible anytime, anywhere and indefinitely through your profile.
Satisfaction guarantee: how does it work?
Our satisfaction guarantee ensures that you always find a study document that suits you well. You fill out a form, and our customer service team takes care of the rest.
Who am I buying these notes from?
Stuvia is a marketplace, so you are not buying this document from us, but from seller Sandratatenda. Stuvia facilitates payment to the seller.
Will I be stuck with a subscription?
No, you only buy these notes for $5.93. You're not tied to anything after your purchase.