stat 200 week 7 homework problems stat200 week 7 homework problems v1 questions amp answers new
2021verified answers
already graded a
Written for
STAT 200 / STAT200
All documents for this subject (10)
Seller
Follow
chamberlain_university
Reviews received
Content preview
STAT 200 Week 7 Homework Problems
10.1.2
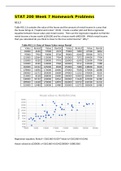
Table #10.1.6 contains the value of the house and the amount of rental income in a year that
the house brings in ("Capital and rental," 2013). Create a scatter plot and find a regression
equation between house value and rental income. Then use the regression equation to find the
rental income a house worth $230,000 and for a house worth $400,000. Which rental income
that you calculated do you think is closer to the true rental income? Why?
House value vs. Rental Income
14000
13000
12000
11000
Rental Income
10000
9000
8000
7000
6000
5000
4000
55000 95000 135000 175000 215000 255000 295000 335000
House Value
Regression equation: Rental = 5363.865+0.024*Value (y=5363.865+0.024x)
House valued at $230000: y=5363.865+0.024(230000)= 10883.865
, House valued at $400000: y= 5363.865+0.024(230000)= 14963.865
Rental income for a house valued at $230000 is closer to the true rental income because these
values are within the original values (interpolating).
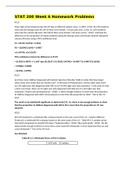
10.1.4
The World Bank collected data on the percentage of GDP that a country spends on health
expenditures ("Health expenditure," 2013) and also the percentage of women receiving
prenatal care ("Pregnant woman receiving," 2013). The data for the countries where this
information are available for the year 2011 is in table #10.1.8. Create a scatter plot of the data
and find a regression equation between percentage spent on health expenditure and the
percentage of women receiving prenatal care. Then use the regression equation to find the
percent of women receiving prenatal care for a country that spends 5.0% of GDP on health
expenditure and for a country that spends 12.0% of GDP. Which prenatal care percentage that
you calculated do you think is closer to the true percentage? Why?
Table #10.1.8: Data of Health Expenditure versus Prenatal Care
Health Prenatal
Expenditur Care (%)
e (% of
GDP)
9.6 47.9
3.7 54.6
5.2 93.7
5.2 84.7
10.0 100.0
4.7 42.5
4.8 96.4
6.0 77.1
5.4 58.3
4.8 95.4
4.1 78.0
6.0 93.3
9.5 93.3
6.8 93.7
6.1 89.8
The benefits of buying summaries with Stuvia:
Guaranteed quality through customer reviews
Stuvia customers have reviewed more than 700,000 summaries. This how you know that you are buying the best documents.
Quick and easy check-out
You can quickly pay through credit card or Stuvia-credit for the summaries. There is no membership needed.
Focus on what matters
Your fellow students write the study notes themselves, which is why the documents are always reliable and up-to-date. This ensures you quickly get to the core!
Frequently asked questions
What do I get when I buy this document?
You get a PDF, available immediately after your purchase. The purchased document is accessible anytime, anywhere and indefinitely through your profile.
Satisfaction guarantee: how does it work?
Our satisfaction guarantee ensures that you always find a study document that suits you well. You fill out a form, and our customer service team takes care of the rest.
Who am I buying these notes from?
Stuvia is a marketplace, so you are not buying this document from us, but from seller chamberlain_university. Stuvia facilitates payment to the seller.
Will I be stuck with a subscription?
No, you only buy these notes for $14.49. You're not tied to anything after your purchase.