, Oefening 1
Stap 1: variabelen definiëren
Voedingsgedrag: kwantitatieve variabele
Leeftijd: kwalitatieve variabele (jongste groep – oudste groep)
Geslacht: kwalitatieve variabele
Stap 2: frequenties laten lopen van alle variabelen en checken op fouten
à Voedingsgedrag heeft een score tussen 3 en 25.
à Score ‘29’ bij voedingsgedrag klopt niet: definiëren als ‘missing variable’
Stap 3: Test uitvoeren
Two-way ANOVA
Stap 4: resultaten
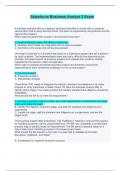
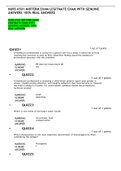
- Interactie-effect: F 11,17 P 0,001 => Significant interactie-effect
- Plots interpreteren:
Bij een significant interactie-effect moet je de plot overtekenen!
De score op voedingsgedrag is bij de jongens het laagste bij de oudste groep en het hoogste bij de
jongste groep.
Bij de meisjes scoren de jongste meisjes het slechtste op voedingsgedrag, de oudste meisjes scoren
daar het beste.
- Gemiddeldes:
De jongste groep bij de jongens scoort gemiddeld 12,86 sd 4,61. De oudste groep jongens
gemiddeld 9,33 sd 5,32.
De jongste meisjes scoren gemiddeld 7,50 sd 2,98. De oudste meisjes gemiddeld 11,44 sd 3,17.
Oefening 2
Stap 1: variabelen definiëren
Bewegingsgedrag: kwantitatieve variabele
Voedingsgedrag: kwantitatieve variabele
Groep: Kwalitatieve variabele
Stap 2: frequenties laten lopen van alle variabelen en checken op fouten
Stap 3: Test uitvoeren
One-Way-ANOVA 2x uitvoeren
Stap 4: resultaten
Bewegingsgedrag
Groep 1: Gemiddeld 13,41 sd 2,83
Groep 2: gemiddeld 13,25 sd 5,08
Groep 3: Gemiddeld 12,26 sd 4,59
Levene’s test: F 1,16 P 0,32. => Levene’s test is niet significant.
ANOVA: F 0,44 P 0,64 => Er is geen significant verschil in bewegingsgedrag volgens de 3 groepen.
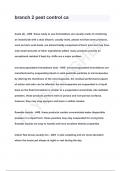
Voedingsgedrag
Groep 1: Gemiddeld 9,54 sd 2,75
Groep 2: Gemiddeld 10,83 sd 4,67
Groep 3: Gemiddeld 12,83 sd 4,94
Stap 1: variabelen definiëren
Voedingsgedrag: kwantitatieve variabele
Leeftijd: kwalitatieve variabele (jongste groep – oudste groep)
Geslacht: kwalitatieve variabele
Stap 2: frequenties laten lopen van alle variabelen en checken op fouten
à Voedingsgedrag heeft een score tussen 3 en 25.
à Score ‘29’ bij voedingsgedrag klopt niet: definiëren als ‘missing variable’
Stap 3: Test uitvoeren
Two-way ANOVA
Stap 4: resultaten
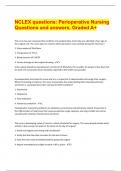
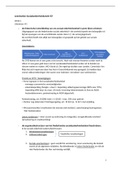
- Interactie-effect: F 11,17 P 0,001 => Significant interactie-effect
- Plots interpreteren:
Bij een significant interactie-effect moet je de plot overtekenen!
De score op voedingsgedrag is bij de jongens het laagste bij de oudste groep en het hoogste bij de
jongste groep.
Bij de meisjes scoren de jongste meisjes het slechtste op voedingsgedrag, de oudste meisjes scoren
daar het beste.
- Gemiddeldes:
De jongste groep bij de jongens scoort gemiddeld 12,86 sd 4,61. De oudste groep jongens
gemiddeld 9,33 sd 5,32.
De jongste meisjes scoren gemiddeld 7,50 sd 2,98. De oudste meisjes gemiddeld 11,44 sd 3,17.
Oefening 2
Stap 1: variabelen definiëren
Bewegingsgedrag: kwantitatieve variabele
Voedingsgedrag: kwantitatieve variabele
Groep: Kwalitatieve variabele
Stap 2: frequenties laten lopen van alle variabelen en checken op fouten
Stap 3: Test uitvoeren
One-Way-ANOVA 2x uitvoeren
Stap 4: resultaten
Bewegingsgedrag
Groep 1: Gemiddeld 13,41 sd 2,83
Groep 2: gemiddeld 13,25 sd 5,08
Groep 3: Gemiddeld 12,26 sd 4,59
Levene’s test: F 1,16 P 0,32. => Levene’s test is niet significant.
ANOVA: F 0,44 P 0,64 => Er is geen significant verschil in bewegingsgedrag volgens de 3 groepen.
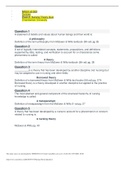
Voedingsgedrag
Groep 1: Gemiddeld 9,54 sd 2,75
Groep 2: Gemiddeld 10,83 sd 4,67
Groep 3: Gemiddeld 12,83 sd 4,94