Exam (elaborations)
University of the People MATH 1281Graded Quiz Unit 6
- Course
- Institution
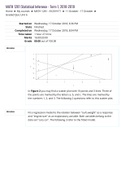
In Figure 2 you may Ònd a scatter plot with 10 points and 3 lines. Three of the points are marked by the letters a, b, and c. The lines are marked by the numbers 1, 2, and 3. The following 2 questi ons refer to this scatter plot. Fit a regression model to the relation between "t" as a response and...
[Show more]


