EVM 101 Module 5 Tests with answers
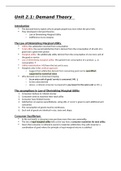
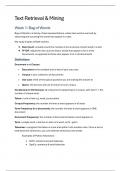
1) What are typical steps involved in completing an integrated analysis using Earned Value Management (EVM) data? [Recognize the steps and sub-steps of a three-step Integrated Analysis Model] Analyze Past Performance, Predict Future Performance, Formulate a Plan of Action Analyze Past Performance, Predict Future Performance, Document Findings Analyze Past Performance, Document Findings, Publish Report Develop EVM metrics, Develop EVM charts, Publish Analysis Report 2) Select the statement that best describes how a technical team member participates in Earned Value Management (EVM) analysis: [Recognize typical Program Management Office Integrated Product Team member roles in EVM analysis.] Interpreting the technical performance measures (TPMs) and correlating them to cost and schedule variances Determining if sufficient funds are available in each fiscal year Approving over target baselines (OTBs) Approving the contractor's Earned Value Management System (EVMS) 3) Which of the following describes the purpose of data validation checks? [Recognize key tasks in analyzing past performance.] To make sure the Integrated Program Management Report (IPMR) data do not contain anomalies that would make them invalid and negatively impact management decision making. To validate pricing data against market research To ensure the contractor is providing data in accordance with the Acquisition Plan To ensure contract technical performance measures (TPMs) accurately describe desired capabilities 4) What does this chart tell you about contractor management reserve (MR) usage? (IMAGE DESCRIPTION: Sample chart showing monthly management reserve (MR) usage, cost variance (CV), and schedule variance (SV) from May 14 through September 14. Approximate MR values are: May 2.2, June 2.1, July 1.5, August 1.3, September 1.2. Approximate CV values are: May -0.4, June -1.0, July -0.7, August -0.8, September -0.7. Approximate SV values are: May -0.7, June -0.8, July -0.9, August -1.1, September - 0.9.) [Given sample charts showing management reserve (MR) usage, interpret the chart.] [Remediation Accessed :N] It shows a reduction in MR over time, indicating MR has been used. It shows that MR is increasing over time so the contractor must not be allocating MR to the performance measurement baseline (PMB). It shows that MR use is causing favorable cost variances. It shows that MR use is causing an unfavorable schedule variance. 5) What can you conclude from the Fuel Consumption technical performance measure (TPM) shown here? (IMAGE DESCRIPTION: Operating Power June 14 TPM. The objective for the fuel consumption TPM is 4 and the threshold is 4.5. The plan for this TPM starts at 10 in the first quarter and then decreases by approximately 1 each quarter until the 8th quarter where it flattens out at 4 for the remaining period shown on the chart. For the entire amount of time plotted on this chart, the plan stays within the upper and lower tolerance levels. The actual performance of the fuel consumption is within tolerance the first two quarters. In quarter three, it begins a steady trend outside of the upper tolerance, decreasing from approximately 9.5 to approximately 7.5 in the sixth quarter. This approximate values in quarter sixe are: plan 5, threshold 4.5, and objective 4.) [Given a risk matrix, TPMs, and Integrated Program Management Report (IPMR) Format 1 reports, recognize that TPM analysis may provide early indicators of problems that may result in cost and schedule performance problems] The Fuel Consumption TPM’s out of tolerance performance may be an early warning indicator of future unfavorable cost and schedule performance that merits management attention. The Fuel Consumption TPM trend is moving back towards the upper tolerance, so this does not merit management attention. It is too early to make any conclusions or take management action as a result of what this TPM shows. The trend is disturbing but unlikely to affect cost or schedule for the associated Work Breakdown Structure (WBS) elements. 6) This excerpt from an Integrated Master Schedule (IMS) has been designed to show what sort of information that can help identify schedule drivers? (IMAGE DESCRIPTION: A Gantt chart for a sample project displays a project with 8
Written for
- Institution
- EVM 101 Module 5 Test
- Course
- EVM 101 Module 5 Test
Document information
- Uploaded on
- August 31, 2021
- Number of pages
- 8
- Written in
- 2021/2022
- Type
- Exam (elaborations)
- Contains
- Questions & answers
Subjects
-
1 what are typical steps involved in completing an integrated analysis using earned value management evm data recognize the steps and sub steps of a three step integrated analysis model analyze