BMC Answers 2019/2020, Complete Solutions University Of Massachusetts, Lowell
BMC Answers 2019/2020, Complete solutions University of Massachusetts, Lowell.
Exam (elaborations)
BMC Answers (Bloomberg) 2019/2020, Complete solutions (A+ guide) University of Massachusetts, Lowell.
8 views 0 purchase
Course
BMC Answers 2019/2020, Complete solutions University of Massachusetts, Lowell.
Institution
BMC Answers 2019/2020, Complete Solutions University Of Massachusetts, Lowell
Bloomberg Answers Economic Indicators The Primacy of GDP (30 min.) Knowledge Check 1 How accurately do GDP statistics portray the economy and why? Knowledge Check 2 Consider the formula GDP = C I (X-M). A country is undergoing a boom in consumption of domestic and foreign luxury goods. In one year,...
complete solutions a guide university of massachusetts
lowell
Written for
BMC Answers 2019/2020, Complete solutions University of Massachusetts, Lowell.
All documents for this subject (1)
Seller
Follow
EvaTee
Reviews received
Content preview
Your text here
Bloomberg Answers
Economic Indicators
The Primacy of GDP (30 min.)
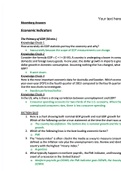
Knowledge Check 1
How accurately do GDP statistics portray the economy and why?
Inaccurately because the scope of GDP measurements can change.
Knowledge Check 2
Consider the formula GDP = C + I + (X-M).
(X- M). A country is undergoing a boom in consu
domestic and foreign luxury goods. In one year, the dollar growth in imports is grea
dollar growth in domestic consumption. Assuming nothing else has changed, what
GDP?
It went down.
Knowledge Check 3
Here is the most important economic data for Australia and Sweden. Which econom
year-over-year (YOY) in the fourth quarter of 2013 compared to the fourth quarter
Use the two charts to investigate.
Sweden performed better.
Knowledge Check 4
In the US, why is
i s there a strong correlation between unemployment and GDP?
Consumer spending accounts for two-thirds of the U.S. economy. When the
unemployed consumers rises, there is less consumer spending.
SECTION QUIZ
1. Here is a chart showing both nominal GDP growth and real GDP growth for
Which of the following can be a true statement at the time the chart was ca
a. The country has deflation. The bottom line isi s nominal growth and the to
growth.
2. Which of the following lines is the best leading economic factor?
a. PMI
3. The “misery index” is often cited in the media as a way to measure consum
defined as the inflation rate plus the unemployment rate. Review and ident
country with the highest “misery index.”
a. Argentina
4. What typically happens to nonfarm payrolls, the PMI indicator, and housing
onset of a recession in the United States?
a. Nonfarm payrolls go DOWN, the PMI indicator goes DOWN, the housing
DOWN.
, Monitoring GDP (10 min.)
SECTION QUIZ
1. Which of the following qualities of economic indicators do investors prize th
a. Timeliness of release.
2. Why is the release of GDP statistics less interesting to investors than the rel
economic indicators?
a. Because GDP statistics are released well after other economic indica
3. Which of the following important U.S. economic indicators is only available
quarterly basis?
a. GDP
4. Which economic indicator is most directly linked to unemployment?
a. Nonfarm payrolls.
Forecasting GDP (20 min.)
Knowledge Check 1
Here is the economic calendar for the UK for August 2013. Examine indicators like P
prices, industrial production, employment, retail sales, and GDP. Based on these m
indicators, how did the UK economy perform overall?
Above Expectations
Knowledge Check 2
This chart was captured in mid-2014. At that point in time, which of the following te
have described the growth in the Chinese economy predicted in this pop -out table?
Deceleration
Knowledge Check 3
How have economic forecasts for this economy evolved?
Minimal Change
SECTION QUIZ
1. These charts show data for four countries as of early 2016. For each country
line denotes historic real GDP growth. The white line denotes the consensu
real GDP growth. The red line denotes the most pessimistic analyst forecast
line denotes the most optimistic analyst forecast. For which country is there
controversy among the analyst community about 2016 growth?
a. RUSSIA
2. What is the main reason that investment banks create estimates of econom
indicators?
a. To know when specific economic data points are a positive or negati
3. Which of the following is the biggest pitfall of economic indicators?
a. They do not consistently presage turning points.
4. Here is a chart displaying estimates of the initial jobless claims indicator, on
main unemployment statistics in the U.S. It measures the number of new ap
The benefits of buying summaries with Stuvia:
Guaranteed quality through customer reviews
Stuvia customers have reviewed more than 700,000 summaries. This how you know that you are buying the best documents.
Quick and easy check-out
You can quickly pay through credit card or Stuvia-credit for the summaries. There is no membership needed.
Focus on what matters
Your fellow students write the study notes themselves, which is why the documents are always reliable and up-to-date. This ensures you quickly get to the core!
Frequently asked questions
What do I get when I buy this document?
You get a PDF, available immediately after your purchase. The purchased document is accessible anytime, anywhere and indefinitely through your profile.
Satisfaction guarantee: how does it work?
Our satisfaction guarantee ensures that you always find a study document that suits you well. You fill out a form, and our customer service team takes care of the rest.
Who am I buying these notes from?
Stuvia is a marketplace, so you are not buying this document from us, but from seller EvaTee. Stuvia facilitates payment to the seller.
Will I be stuck with a subscription?
No, you only buy these notes for $11.98. You're not tied to anything after your purchase.