Week 7 Hypothesis Testing Q & A
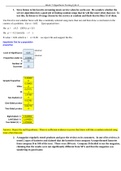
1. Steve listens to his favorite streaming music service when he works out. He wonders whether the
service algorithm does a good job of finding random songs that he will like more often than not. To
test this, he listens to 50 songs chosen by the service at random and finds that he likes 32 of them.
Use Excel to test whether Steve will like a randomly selected song more than not and then draw a conclusion in the
context of a problem. Use α = 0.05. Type equation here .
Ho: p = ≤ 0.5 (50%) p = 0.5
Ha: p = > 0.5 (strictly ¿ ≠ )
P-value = 0.02 which is < α =0.05 we reject Ho and support the Ha
Hypothesis Test for p population
proportion
(decimal
Level of Significance 0.05 )
(decimal
Proportion under H0 0.5000 )
n 50
Number of
Successes 32
0.64000
Sample Proportion 0
0.50000
StDev 0
0.07071
SE 1
1.97989
Test Statistic (z) 9
0.02385
One-Sided p-value 2
0.04770
Two-Sided p-value 4
Right-Tailed (>) 1.644854
Left-Tailed (<) -1.644854
Two-Tailed (≠) ± 1.959964
Answer: Reject the null hypothesis. There is sufficient evidence to prove that Steve will like a random selected song
more often than not.
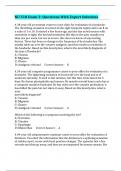
2. A magazine regularly tested products and gave the reviews to its customers. In one of its reviews, it
tested 2 types of batteries and claimed that the batteries from company A outperformed batteries
from company B in 108 of the tests. There were 200 tests. Company B decided to sue the magazine,
claiming that the results were not significantly different from 50% and that the magazine was
slandering its good name.
,Use Excel to test whether the true proportion of times that Company A’s batteries outperformed Company B’s batteries is
different from 0.5. Identify the p=value rounding it to 3 decimal places.
Ho: p = 0.5 Ha ≠ 0.5 (two tailed test) n = 200 (α is not given so leave it 0.05)
Hypothesis Test for p population
proportion
Level of Significance 0.05
Proportion under H0 0.5000
n 200
Number of Successes 108
Sample Proportion 0.540000
StDev 0.500000
SE 0.035355
Test Statistic (z) 1.131371
One-Sided p-value 0.129238
Two-Sided p-value 0.258476
Right-Tailed (>) 1.644854
-
Left-Tailed (<) 1.644854
Two-Tailed (≠) ± 1.959964
Answer: 0.258 (because it is a two tailed test). We are not rejecting the null hypothesis and we do not have evidence to
support the alternative hypothesis.
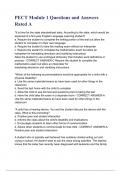
3. A candidate in an election lost by 5.8% of the vote. The candidate sued the state and said that more
than 5.8% of the ballots were defective and not counted by the voting machine, so a full recount
would need to be done. His opponent wanted to ask for the case to be dismissed, so she had a
government official from the state randomly select 500 ballots and count how many were defective.
The official found 21 defective ballots.
Use Excel to test if the candidates claim is true and that < 5.8% of the ballots were defective. Identify the p=value
rounding to 3 decimal places.
Ho: p = ≥ 0.058 Ha ¿ 0.058 (one tailed test) n = 500 (α is not given so leave it 0.05)
Hypothesis Test for p population
proportion
Level of Significance 0.05 (decimal)
Proportion under H0 0.0580 (decimal)
n 500
Number of Successes 21
Sample Proportion 0.042000
StDev 0.233743
SE 0.010453
Test Statistic (z) -
, 1.530613
One-Sided p-value 0.063008
Two-Sided p-value 0.126016
Right-Tailed (>) 1.644854
Left-Tailed (<) -1.644854
Two-Tailed (≠) ± 1.959964
Answer: 0.063
4. A researcher claims that the incidence of a certain type of cancer is < 5%. To test this claim, a
random sample of 4000 people are checked and 170 are found to have the cancer.
The following is the set up for the hypothesis:
Ho = 0.05
Ha = < 0.05
In the example the p-value was determined to be 0.015.
Come to a conclusion and interpret the results of this hypothesis test for a proportion (use a significance level of 5%)
Answer: The decision is to reject the null hypothesis. The conclusion is that there is enough evidence to support the
claim.
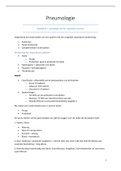
5. A researcher is investigating a government claim that the unemployment rate is < 5%. TO test this
claim, a random sample of 1500 people is taken and it is determined that 61 people were
unemployed.
Ho: p = 0.05 Ha: p < 0.05
Find the p-value for this hypothesis test for a proportion & round to 3 decimal places.
Hypothesis Test for p
population proportion
Level of Significance 0.05
Proportion under H0 0.0500
n 1500
Number of
Successes 61
0.04066
Sample Proportion 7
0.21794
StDev 5
0.00562
SE 7
Test Statistic (z) -
1.65857
, 7
0.04845
One-Sided p-value 7
0.09691
Two-Sided p-value 4
Answer: 0.048
6. An economist claims that the proportion of people that plan to purchase a fully electric vehicle as
their next car is greater than 65%.
To test this claim, a random sample of 750 people were asked if they planned to purchase a fully electric vehicle as their
next car. Of this 750, 513 indicated that they plan to purchase an electric vehicle.
Ho: p = 0.65 Ha; p = >0.65
Find the p-value for this hypothesis test for a proportion & round to 3 decimal places.
Hypothesis Test for p
population proportion
Level of Significance 0.05
Proportion under H0 0.6500
n 750
Number of
Successes 513
0.68400
Sample Proportion 0
0.47697
StDev 0
0.01741
SE 6
1.95217
Test Statistic (z) 5
0.02558
One-Sided p-value 8
0.05117
Two-Sided p-value 6
Answer: 0.026
7. Colton makes the claim to his classmates that < 50% of newborn babies born this year in his state
are boys. To prove this claim, he selects a random sample of 344 birth records in his state from this
year. Colton found that 176 of the newborns were boys. What are the null and alternative
hypothesis for this hypothesis test.
Answer: Ho: 0.5
1. Steve listens to his favorite streaming music service when he works out. He wonders whether the
service algorithm does a good job of finding random songs that he will like more often than not. To
test this, he listens to 50 songs chosen by the service at random and finds that he likes 32 of them.
Use Excel to test whether Steve will like a randomly selected song more than not and then draw a conclusion in the
context of a problem. Use α = 0.05. Type equation here .
Ho: p = ≤ 0.5 (50%) p = 0.5
Ha: p = > 0.5 (strictly ¿ ≠ )
P-value = 0.02 which is < α =0.05 we reject Ho and support the Ha
Hypothesis Test for p population
proportion
(decimal
Level of Significance 0.05 )
(decimal
Proportion under H0 0.5000 )
n 50
Number of
Successes 32
0.64000
Sample Proportion 0
0.50000
StDev 0
0.07071
SE 1
1.97989
Test Statistic (z) 9
0.02385
One-Sided p-value 2
0.04770
Two-Sided p-value 4
Right-Tailed (>) 1.644854
Left-Tailed (<) -1.644854
Two-Tailed (≠) ± 1.959964
Answer: Reject the null hypothesis. There is sufficient evidence to prove that Steve will like a random selected song
more often than not.
2. A magazine regularly tested products and gave the reviews to its customers. In one of its reviews, it
tested 2 types of batteries and claimed that the batteries from company A outperformed batteries
from company B in 108 of the tests. There were 200 tests. Company B decided to sue the magazine,
claiming that the results were not significantly different from 50% and that the magazine was
slandering its good name.
,Use Excel to test whether the true proportion of times that Company A’s batteries outperformed Company B’s batteries is
different from 0.5. Identify the p=value rounding it to 3 decimal places.
Ho: p = 0.5 Ha ≠ 0.5 (two tailed test) n = 200 (α is not given so leave it 0.05)
Hypothesis Test for p population
proportion
Level of Significance 0.05
Proportion under H0 0.5000
n 200
Number of Successes 108
Sample Proportion 0.540000
StDev 0.500000
SE 0.035355
Test Statistic (z) 1.131371
One-Sided p-value 0.129238
Two-Sided p-value 0.258476
Right-Tailed (>) 1.644854
-
Left-Tailed (<) 1.644854
Two-Tailed (≠) ± 1.959964
Answer: 0.258 (because it is a two tailed test). We are not rejecting the null hypothesis and we do not have evidence to
support the alternative hypothesis.
3. A candidate in an election lost by 5.8% of the vote. The candidate sued the state and said that more
than 5.8% of the ballots were defective and not counted by the voting machine, so a full recount
would need to be done. His opponent wanted to ask for the case to be dismissed, so she had a
government official from the state randomly select 500 ballots and count how many were defective.
The official found 21 defective ballots.
Use Excel to test if the candidates claim is true and that < 5.8% of the ballots were defective. Identify the p=value
rounding to 3 decimal places.
Ho: p = ≥ 0.058 Ha ¿ 0.058 (one tailed test) n = 500 (α is not given so leave it 0.05)
Hypothesis Test for p population
proportion
Level of Significance 0.05 (decimal)
Proportion under H0 0.0580 (decimal)
n 500
Number of Successes 21
Sample Proportion 0.042000
StDev 0.233743
SE 0.010453
Test Statistic (z) -
, 1.530613
One-Sided p-value 0.063008
Two-Sided p-value 0.126016
Right-Tailed (>) 1.644854
Left-Tailed (<) -1.644854
Two-Tailed (≠) ± 1.959964
Answer: 0.063
4. A researcher claims that the incidence of a certain type of cancer is < 5%. To test this claim, a
random sample of 4000 people are checked and 170 are found to have the cancer.
The following is the set up for the hypothesis:
Ho = 0.05
Ha = < 0.05
In the example the p-value was determined to be 0.015.
Come to a conclusion and interpret the results of this hypothesis test for a proportion (use a significance level of 5%)
Answer: The decision is to reject the null hypothesis. The conclusion is that there is enough evidence to support the
claim.
5. A researcher is investigating a government claim that the unemployment rate is < 5%. TO test this
claim, a random sample of 1500 people is taken and it is determined that 61 people were
unemployed.
Ho: p = 0.05 Ha: p < 0.05
Find the p-value for this hypothesis test for a proportion & round to 3 decimal places.
Hypothesis Test for p
population proportion
Level of Significance 0.05
Proportion under H0 0.0500
n 1500
Number of
Successes 61
0.04066
Sample Proportion 7
0.21794
StDev 5
0.00562
SE 7
Test Statistic (z) -
1.65857
, 7
0.04845
One-Sided p-value 7
0.09691
Two-Sided p-value 4
Answer: 0.048
6. An economist claims that the proportion of people that plan to purchase a fully electric vehicle as
their next car is greater than 65%.
To test this claim, a random sample of 750 people were asked if they planned to purchase a fully electric vehicle as their
next car. Of this 750, 513 indicated that they plan to purchase an electric vehicle.
Ho: p = 0.65 Ha; p = >0.65
Find the p-value for this hypothesis test for a proportion & round to 3 decimal places.
Hypothesis Test for p
population proportion
Level of Significance 0.05
Proportion under H0 0.6500
n 750
Number of
Successes 513
0.68400
Sample Proportion 0
0.47697
StDev 0
0.01741
SE 6
1.95217
Test Statistic (z) 5
0.02558
One-Sided p-value 8
0.05117
Two-Sided p-value 6
Answer: 0.026
7. Colton makes the claim to his classmates that < 50% of newborn babies born this year in his state
are boys. To prove this claim, he selects a random sample of 344 birth records in his state from this
year. Colton found that 176 of the newborns were boys. What are the null and alternative
hypothesis for this hypothesis test.
Answer: Ho: 0.5