Business Statistics, Cdn. 2e (Sharpe)
Part I: Exploring and Collecting Data
Multiple Choice - Test A
1) In listing a property, real estate agencies provides information on a number of
variables. Which of the following variables related to property listings is categorical?
A) Real Estate Tax
B) Number of Bedrooms
C) Style of Home
D) Asking Price
E) Number of Bathrooms
Answer: C
L.O.: 2-2
2) What type of variable is the style of a home (bungalow, split level, ranch etc)?
A) Nominal
B) Interval
C) Quantitative
D) Ordinal
E) Numerical
Answer: A
L.O.: 2-2
3) Real estate agencies also keep track of housing prices in a given area. Suppose they
also provide their clients with quarterly median selling prices for homes in a given area
,for the past three year period. These data are
A) Cross-sectional
B) Time Series
C) Categorical
D) Nominal
E) Ordinal
Answer: B
L.O.: 2-2
4) A researcher is conducting a study on eating disorders. Using a list of recent
participants in the online Weight Watchers program, she randomly selects a name from
the alphabetized list. She then chooses every tenth person from that point on to include in
her study. This sampling strategy is called
A) Systematic
B) Cluster
C) Random
D) Stratified
E) Judgmental
Answer: A
L.O.: 3-1, 3-3
Use the following to answer the question(s) below.
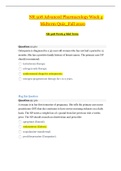
A magazine that publishes product reviews conducted a survey of teenagers' preferences
for cell phones. Three brands of cell phone designed specifically with teens in mind were
the focus of the study. The table summarizes responses by brand and gender.
Cell Phone Male Female
,LG Rumour 55 87
Sidekick LX 99 150
BlackJack II 196 113
5) Which of the following charts would be appropriate for displaying the marginal
distribution of brands?
A) Histogram
B) Boxplot
C) Pie Chart
D) Line Graph
E) Stem-and-Leaf Display
Answer: C
L.O.: 4-1, 4-2
6) What percent of teenagers preferred LG Rumour?
A) 50%
B) 41%
C) 25%
D) 16%
E) 20%
Answer: E
L.O.: 4-2
7) What percent of female teenagers preferred the Sidekick LX?
, A) 43%
B) 60%
C) 21%
D) 50%
E) 16%
Answer: A
L.O.: 4-2
8) What percent of teenagers who preferred the BlackJack II were males?
A) 63%
B) 32%
C) 16%
D) 50%
E) 41%
Answer: A
L.O.: 4-2
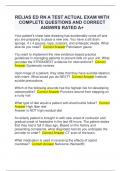
9) Which is true of the data shown in the histogram?
Part I: Exploring and Collecting Data
Multiple Choice - Test A
1) In listing a property, real estate agencies provides information on a number of
variables. Which of the following variables related to property listings is categorical?
A) Real Estate Tax
B) Number of Bedrooms
C) Style of Home
D) Asking Price
E) Number of Bathrooms
Answer: C
L.O.: 2-2
2) What type of variable is the style of a home (bungalow, split level, ranch etc)?
A) Nominal
B) Interval
C) Quantitative
D) Ordinal
E) Numerical
Answer: A
L.O.: 2-2
3) Real estate agencies also keep track of housing prices in a given area. Suppose they
also provide their clients with quarterly median selling prices for homes in a given area
,for the past three year period. These data are
A) Cross-sectional
B) Time Series
C) Categorical
D) Nominal
E) Ordinal
Answer: B
L.O.: 2-2
4) A researcher is conducting a study on eating disorders. Using a list of recent
participants in the online Weight Watchers program, she randomly selects a name from
the alphabetized list. She then chooses every tenth person from that point on to include in
her study. This sampling strategy is called
A) Systematic
B) Cluster
C) Random
D) Stratified
E) Judgmental
Answer: A
L.O.: 3-1, 3-3
Use the following to answer the question(s) below.
A magazine that publishes product reviews conducted a survey of teenagers' preferences
for cell phones. Three brands of cell phone designed specifically with teens in mind were
the focus of the study. The table summarizes responses by brand and gender.
Cell Phone Male Female
,LG Rumour 55 87
Sidekick LX 99 150
BlackJack II 196 113
5) Which of the following charts would be appropriate for displaying the marginal
distribution of brands?
A) Histogram
B) Boxplot
C) Pie Chart
D) Line Graph
E) Stem-and-Leaf Display
Answer: C
L.O.: 4-1, 4-2
6) What percent of teenagers preferred LG Rumour?
A) 50%
B) 41%
C) 25%
D) 16%
E) 20%
Answer: E
L.O.: 4-2
7) What percent of female teenagers preferred the Sidekick LX?
, A) 43%
B) 60%
C) 21%
D) 50%
E) 16%
Answer: A
L.O.: 4-2
8) What percent of teenagers who preferred the BlackJack II were males?
A) 63%
B) 32%
C) 16%
D) 50%
E) 41%
Answer: A
L.O.: 4-2
9) Which is true of the data shown in the histogram?