CHAPTER 4.
TOOLS OF THE FORECASTER
SOLUTIONS
by
Wei Lin and Yingying Sun
(University of California, Riverside)
Note: The house price index for Exercises 1 to 4 is different from the house price index presented
in the textbook (Section 4.1.1 and Table 4.1). Both are downloaded from Freddie Ma...
chapter 4 tools of the forecaster solutions by wei lin and yingying sun university of california
riverside note the house price index for exercises 1 to 4 is different from the house price index
Written for
EC 410
All documents for this subject (12)
Seller
Follow
ExamsConnoisseur
Reviews received
Content preview
Gloria González-Rivera Forecasting For Economics and Business 2013
CHAPTER 4.
TOOLS OF THE FORECASTER
SOLUTIONS
by
Wei Lin and Yingying Sun
(University of California, Riverside)
Note: The house price index for Exercises 1 to 4 is different from the house price index presented
in the textbook (Section 4.1.1 and Table 4.1). Both are downloaded from Freddie Mac’s website.
In the textbook, the time series is the Conventional Mortgage Home Price Index (CMHPI), which
is a weighted average of nine census region indexes. In February 2011, Freddie Mac discontinued
the publication of CMHPI and replaced it with the Freddie Mac House Price Index (FMHPI)
http://www.freddiemac.com/finance/fmhpi. FMHPI is a weighted average of state indexes. The
base month of the index is December 2000, i.e. FMHPI = 100. Consequently, the regression results
in Table 4.1 of the textbook are not comparable to the regression results presented in Exercises 1
to 4.
Exercise 1
We present the ACFs and PACFs of house prices (P ), interest rates (R) and their changes (DP
and DR) in Figures 1 to 4. The time series in levels (P and R) have similar profiles: strong
autocorrelations that decay slowly towards zero in the ACFs, and a first order prominent spike,
larger than 0.90 and statistically significant from zero, in the PACFs (observe the confidence bands
for the null hypothesis of zero autocorrelation). The time series of changes in prices and rates
exhibit much weaker autocorrelation. However, the two series are very different. While changes in
interest rates are not autocorrelated (a barely significant autocorrelation of order one), changes in
house prices exhibit short term (about 2 years) autocorrelation. This means that we will be able
to exploit time dependence in yearly price growth for forecasting purposes but it will be difficult
to do so in forecasting interest rate changes.
Figure 1: ACF, PACF and Q-Statistic of P
1
,Gloria González-Rivera Forecasting For Economics and Business 2013
Figure 2: ACF, PACF and Q-Statistic of R
Figure 3: ACF, PACF and Q-Statistic of DP
Figure 4: ACF, PACF and Q-Statistic of DR
2
, Gloria González-Rivera Forecasting For Economics and Business 2013
Exercise 2
We estimate the following regression models
i. ∆pt = α0 + α1 ∆pt−1 + α2 ∆pt−2 + ut
ii. ∆pt = α0 + α1 ∆pt−1 + α2 ∆pt−2 + β1 ∆rt−1 + β2 ∆rt−2 + ut
iii. ∆pt = α0 + α1 ∆pt−1 + α2 ∆pt−2 + α3 ∆pt−3 + α4 ∆pt−4 + ut
iv. ∆pt = α0 + α1 ∆pt−1 + α2 ∆pt−2 + α3 ∆pt−3 + α4 ∆pt−4
+β1 ∆rt−1 + β2 ∆rt−2 + β3 ∆rt−3 + β4 ∆rt−4 + ut
Tables 1 to 4 report the estimation results.
Models (i) and (ii) are virtually identical. The goodness of fit (adjusted R-squared) is about 70% in
both models. It seems that changes in interest rates are not informative to explain changes in house
prices in this sample. This claim is also supported by an F-test for a null hypothesis of no effect
of interest rates, which is F = (322.47−308.83)/2
308.83/(34−5) = 0.64. We compare it with the 5% critical value of
an F2,29 = 3.33 and conclude that the null cannot be rejected, so expanding our information set to
include interest rates will not help with the forecasting of house price changes.
In models (iii) and (iv) we include further dynamics of prices and rates. In model (iii), the im-
provement is marginal. The new regressors are not (or barely) statistically significant at the 5%
level. The goodness of fit has a modest increase to 73%. An F-test of model (iii) versus model (i)
F = (322.47−269.21)/2
269.21/(32−5) = 4.65 reveals that the null hypothesis of no further lags can be rejected at
the 5% level (F2,27 = 3.35) but it cannot at the 1% level (F2,27 = 5.49). Similar comments apply
to model (iv). Comparing model (iv) with model (i), we set the following null hypothesis: lagged
interest rates and lagged (lags 3 and 4) price changes do not have any effect on current price changes
(6 coefficients are claimed to be zero). The corresponding F-test is F = (322.47−244.45)/6
244.45/(32−9) = 1.22 and
the 5% critical value is F6,23 = 2.53. Thus, we fail to reject the null and we settle on model (i). In
summary, a multivariate information set, which includes not only past information on prices but
also on interest rates, is not any more valuable than the univariate information set to explain house
price growth.
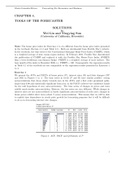
Dependent Variable: DP
Method: Least Squares
Sample (adjusted): 1978 2011
Included observations: 34 after adjustments
Newey-West HAC Standard Errors & Covariance (lag truncation=3)
Variable Coefficient Std. Error t-Statistic Prob.
C 0.660277 0.589296 1.12045 0.2711
DP(-1) 1.239116 0.250548 4.945626 0.0000
DP(-2) -0.538585 0.354404 -1.51969 0.1387
R-squared 0.72172 Mean dependent var 2.655237
Adjusted R-squared 0.703767 S.D. dependent var 5.925817
S.E. of regression 3.225263 Akaike info criterion 5.264003
Sum squared resid 322.4719 Schwarz criterion 5.398682
Log likelihood -86.48805 F-statistic 40.19936
Durbin-Watson stat 1.468675 Prob(F-statistic) 0.000000
Table 1: Regression Results of Model (i)
3
The benefits of buying summaries with Stuvia:
Guaranteed quality through customer reviews
Stuvia customers have reviewed more than 700,000 summaries. This how you know that you are buying the best documents.
Quick and easy check-out
You can quickly pay through credit card or Stuvia-credit for the summaries. There is no membership needed.
Focus on what matters
Your fellow students write the study notes themselves, which is why the documents are always reliable and up-to-date. This ensures you quickly get to the core!
Frequently asked questions
What do I get when I buy this document?
You get a PDF, available immediately after your purchase. The purchased document is accessible anytime, anywhere and indefinitely through your profile.
Satisfaction guarantee: how does it work?
Our satisfaction guarantee ensures that you always find a study document that suits you well. You fill out a form, and our customer service team takes care of the rest.
Who am I buying these notes from?
Stuvia is a marketplace, so you are not buying this document from us, but from seller ExamsConnoisseur. Stuvia facilitates payment to the seller.
Will I be stuck with a subscription?
No, you only buy these notes for $11.49. You're not tied to anything after your purchase.