100% satisfaction guarantee Immediately available after payment Both online and in PDF No strings attached
logo-home
DATA ANALYTICS IN PYTHON $10.49   Add to cart

Class notes

DATA ANALYTICS IN PYTHON

 5 views  0 purchase
  • Course
  • Institution

Python is a popular programming language for data analytics and has many libraries and tools available for data analysis tasks. Some of the popular libraries for data analytics in Python are: NumPy: NumPy is a library that provides support for large, multi-dimensional arrays and matrices. It als...

[Show more]
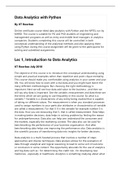
Preview 3 out of 16  pages

  • March 5, 2023
  • 16
  • 2022/2023
  • Class notes
  • Shanthan gurukul
  • All classes
avatar-seller
Data Analytics with Python
By IIT Roorkee

Online certificate course titled data analytics with Python and the NPTEL run by
MHRD. The course is suitable for PG and PhD students of engineering and
management programs as well as entry and middle level managers in analytics
companies. Students completing this course will be controlled in both
conceptual understanding of the analytical methods and also applying them
using Python during the course assignment will be given to the participants for
solving and submitted assignments.


Lec 1, Introduction to Data Analytics
IIT Roorkee July 2018

The objective of this course is to introduce the conceptual understanding using
simple and practical examples rather than repetitive and point clique mentality.
This course should make you comfortable using analytics in your career and your
life. You will know how to work with a real data and you might have learnt the
many different methodologies. But choosing the right methodology is
important. Next we will see how data add value to the business , and then we
will say why data is important. See the variable, measurement and data these are
the terms which we are going to use frequently in this course. So what is a
variable ? Variable is a characteristic of any entity being studied that is capable
of taking on different values. The measurement is when you standard processes
used to assign numbers to your particular attributes or characteristics of variable
are called a measurement. For that X X is the variable for example number 5 is
the data. How you are measuring that 5, that is called measurement. Data helps
in making better decisions, data helps in solving problem by finding the reason
for underperformance. Data also can help one understand the consumers and
the markets, especially the marketing context. The data also can be used for
benchmarking the performance of your business organization. And after
benchmarking data helps one improving the performance also. Data analytics is
the scientific process of transforming data into insights for better decisions.

Data analytics is a multi-faceted process that involves a number of steps
approaches and diverse techniques. Data analysis allows for the evaluation of
data through analytical and logical reasoning to lead to some sort of outcome
or conclusion in some context. The opportunity abounds for the use of analytics
and big data such as : for determining the credit risk , for developing new
medicines , especially in healthcare. Analytics is something studying about what

,has happened in the past. We can predict explore possible potential future
events. So the analytics is maybe qualitative or quantitative. There are four major
types of data analytics. One is descriptive analytics, diagnostic analytics,
predictive analytics and prescriptive analytics. We will see these four types of
analytics in detail in coming classes. Diagnostic analytics is a form of advanced
analytics which examines data or content to answer the question why did it
happen ? In a structured business environment tools for both descriptiv e and
diagnostic analytics go parallel. Predictive analytics helps to forecast trends
based on the current events. Prescriptive analytics is to enable quality
improvements, service enhancements, cost reductions and increasing
productivity.

In this section we will see what is happening the demand for data analytics and
we look at the different elements of data analytics. In the prescriptive analytics ,
some of the tools which we can use is optimization models , simulation model ,
and decision analysis. Next is we are going to see , why the analytics so
important ? In the first section we are to see what kind of skill set is required to
become a data analyst ? We will see the small difference between data analyst
and data scientist ? Python is a free software and open source. It uses
interpreted , it is not the. compiler. Python can solve even you can interpret one
sentence also , one line in the programming line also. Python is very simple and
easy to learn. It is extensible and extensible in the sense if you make a code in
some other language that can be extended with the help of Python. Python is a
desktop and web applications and can be used for data applications. It is easy in
documentation, easy in demonstration and user friendly interface. Most of the
companies use Python as a programming language in their company. Google,
Facebook, NASA, Yahoo and eBay use Python.

The ordinal scale classifies data into distinct categories in which the ranking is
implied. In ordinal you can not do arithmetic operations with the help of the 0 &
1. The next level of data is interval scale. The interval scale is ordered scale. In
the interval you can add and subtract but you can't multiply. In ratio scale you
can do all kinds of arithmetic operations. Different types of data is helping to
choose the right analytical tools for doing analysis. For example the usage
potential of nominal data is not that much. The ratio data is having the highest
to use its potential. N nominal data having the least usage potential. The next
class we will learn about what is Python ? How to install the Python and what
kind of descriptive analysis we can do with the help of Python ?


Lec 2, Python Fundamentals -I
IIT Roorkee July 2018

, Prof. Ramesh Anbanandam will give lecture on how to install Python. In the data
visualization I am going to give only theory in this class. The next class we are
going to use Python and we are. going to take some sample data and we have
to visualize the data using Python software. We prefer Jupyter for some reasons
because it is edit code on web browser. It is easy in documentation and easy in
demonstration and it is user-friendly interface. In anaconda it consists of two
software one is python that is on the left hand side the another side the right
hand side. The Jupster applications are combined together and kept in the
Anaconda software package. There is a run button on the jupyter interface. That
you can directly you can click that. Then your code will get executed command
line is written proceeding with # tag symbol. When you press M that will made a
say mark down cell , when you press Y that is for coding cell. For example ; when
I am entering B. We will go to the next one fundamentals of Python and yo u see
loading here.

Pandas. read_csv is the short-form of pandas. The location of the file given the
path of that file you can directly copy that path but one thing you have to note
it down. So I changed it back C : / users / ET cell / desktop / gapminder -five year
data. csv. The last row is Zimbabwe. When you type print df. shape then we will
come to know how many rows are there. How many columns are there ? How
many column names ? What are the column names? So if I type print. print. df
shape. The next command is to get the data type of each column. This is a
classification of types of data in the perspective of pandas. Data is not loaded by
default that need to be imported. Whenever it is a requirement is there that we
will see that. So you type df. info you will get the full details about each
columns. We will do that one. There may be requirement you need to see more
than one column at a time.

We have seen how to load csv file into the Python, we have seen some basic
commands. How to subset from the given big file ? How to access the 100th row
how to access from the file df ? I want to look at 100th. row how you type print
df. loc 99. You see 0th row access country Afghanistan year 1952 population is
this much continent is Asia. Different small data file ? So that can be used for
our further analysis. So the next class we will see how to access different
columns that will continue in the next lecture. Thank you for your knowledge of
how to use different small data files in this lecture. Back to the page yo u came
from.


Lec 3, Python Fundamentals -II
IIT Roorkee July 2018

The benefits of buying summaries with Stuvia:

Guaranteed quality through customer reviews

Guaranteed quality through customer reviews

Stuvia customers have reviewed more than 700,000 summaries. This how you know that you are buying the best documents.

Quick and easy check-out

Quick and easy check-out

You can quickly pay through credit card or Stuvia-credit for the summaries. There is no membership needed.

Focus on what matters

Focus on what matters

Your fellow students write the study notes themselves, which is why the documents are always reliable and up-to-date. This ensures you quickly get to the core!

Frequently asked questions

What do I get when I buy this document?

You get a PDF, available immediately after your purchase. The purchased document is accessible anytime, anywhere and indefinitely through your profile.

Satisfaction guarantee: how does it work?

Our satisfaction guarantee ensures that you always find a study document that suits you well. You fill out a form, and our customer service team takes care of the rest.

Who am I buying these notes from?

Stuvia is a marketplace, so you are not buying this document from us, but from seller pramodhmkumar. Stuvia facilitates payment to the seller.

Will I be stuck with a subscription?

No, you only buy these notes for $10.49. You're not tied to anything after your purchase.

Can Stuvia be trusted?

4.6 stars on Google & Trustpilot (+1000 reviews)

75759 documents were sold in the last 30 days

Founded in 2010, the go-to place to buy study notes for 14 years now

Start selling
$10.49
  • (0)
  Add to cart