MATH 302 QUIZ 1 – QUESTION AND ANSWERS – SET 1. GRADED A+
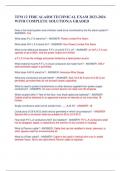
MATH 302 QUIZ 1 – QUESTION AND ANSWERS – SET 1 Question 1 of 20 1.0 / 1.0 Points An advertisement for a car states that it is 10% more powerful than its competitor. This is an example of • A. detached statistics • B. suspect samples • C. changing the subject • D. ambiguous averages Answer Key: A Question 2 of 20 0.0 / 1.0 Points A scatterplot allows one to see: • A. whether there is any relationship between two variables • B. what type of relationship there is between two variables • C. Both (a) and (b) are correct • D. Neither (a) nor (b) is correct Answer Key: C Question 3 of 20 1.0 / 1.0 Points Which of the following are the two most commonly used measures of variability? • A. Variance and standard deviation • B. Variance and median • C. Mean and variance • D. Range and interquartile range Answer Key: A Question 4 of 20 1.0 / 1.0 Points A histogram that has a single peak and looks approximately the same to the left and right of the peak is called: • A. balanced • B. bimodal • C. symmetric • D. proportional Answer Key: C Question 5 of 20 1.0 / 1.0 Points What kind of relationship between x and y is demonstrated by the scatter plot below? A. This is not a scatter plot B. A positive linear relationship C. A negative linear relationship D. No linear relationship Answer Key: C Question 6 of 20 1.0 / 1.0 Points Which of the following statements is true regarding the data set 10, 10, 10, 10, and 10? • A. The range is zero • B. The standard deviation equals zero • C. The interquartile range equals zero • D. all of the above Answer Key: D Question 7 of 20 1.0 / 1.0 Points Which of the following statements is true for the following data values: 7, 5, 6, 4, 7, 8, and 12? A. The mean, median and mode are all equal • B. Only the mean and mode are equal • C. Only the mean and median are equal • D. Only the median and mode are equal Answer Key: A Question 8 of 20 1.0 / 1.0 Points Researchers may gain insight into the characteristics of a population by examining a • A. description of the population B. mathematical model describing the population • C. sample of the population • D. replica Answer Key: C Question 9 of 20 1.0/ 1.0 Points Suppose that a histogram of a data set is approximately symmetric and "bell shaped". Approximately what percent of the observations are within two standard deviations of the mean? • A. 99.7% • B. 95% C. 68% • D. 50% Answer Key: B Question 10 of 20 1.0 / 1.0 Points What is the term for a characteristic or attribute that can assume different values? • A. datum • B. sample • C. exponent • D. variable Answer Key: D Question 11 of 20 1.0 / 1.0 Points Which measure of central location is meaningful when the data are categorical? • A. The mode • B. The mean • C. The range • D. The median Answer Key: A Question 12 of 20 1.0 / 1.0 Points Which of the following are the three most common measures of central location? • A. Mean, median, and standard deviation • B. Mean, median, and mode • C. Mean, median, and variance • D. Mean, variance, and standard deviation Answer Key: B Question 13 of 20 1.0/ 1.0 Points Click to see additional instructions The following data represent the number of children in a sample of 10 families from Chicago: 4, 2, 1, 1, 5, 3, 0, 1, 0, and 2. Compute the median number of children. Place your answer, rounded to two decimal places, in the blank. For example, 3.45 would be a legitimate entry. 1.50 Answer Key: 1.50 Question 14 of 20 1.0/ 1.0 Points Click to see additional instructions The following data represent the number of children in a sample of 10 families from Chicago: 4, 2, 1, 1, 5, 3, 0, 1, 0, and 2. Compute the variance of the data. Place your answer, rounded to two decimal places, in the blank. For example, 3.45 would be a legitimate entry. 2.77 Answer Key: 2.77 Question 15 of 20 1.0/ 1.0 Points Click to see additional instructions The following data are the base salaries, in thousands of dollars, of 50 chief executive officers for a sample of companies doing business with the state of Connecticut. That is, the first entry in the table below corresponds to a salary of $125,000. A copy of this data set can be found in the Excel Workbook called CEOS. 125 157 113 127 201 165 145 119 148 158 148 168 117 105 136 136 125 148 108 178
Written for
- Institution
- Math
- Course
- Math
Document information
- Uploaded on
- March 29, 2023
- Number of pages
- 17
- Written in
- 2022/2023
- Type
- Exam (elaborations)
- Contains
- Questions & answers
Subjects
-
math 302 quiz 1 – question and answers – set 1