Gizmo Scatter plot Answer Key./Trends in Scatter P
Institution
Gizmo Scatter Plot Answer Key./Trends In Scatter P
Gizmo Scatter plot Answer Key./Trends in Scatter Plots Answer Key
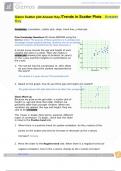
Vocabulary: correlation, scatter plot, slope, trend line, y-intercept
Prior Knowledge Questions (Do these BEFORE using the Gizmo.) [Note: The purpose of these questions is to activate prior knowledge and get students thinki...
Gizmo Scatter plot Answer Key./Trends in Scatter P
All documents for this subject (1)
1
review
By: jprice031 • 4 weeks ago
By: ACADEMICAIDSTORE • 4 weeks ago
Thank you for the good review. Feel free to send us a message through the platform or an email to dan.wasilwa8953@gmail.com anytime you need any exam, additional material or homework help. All the best.
Seller
Follow
ACADEMICAIDSTORE
Reviews received
Content preview
Please Do Not Share windhammiddle3 / tparker@windhamsd.org
Gizmo Scatter plot Answer Key./Trends in Scatter Plots Answer
Key
Prior Knowledge Questions (Do these BEFORE using the
Gizmo.) [Note: The purpose of these questions is to activate prior
knowledge and get students thinking. Students who do not already
know the answers will benefit from the class discussion.]
A school nurse records the age and height of each
student she sees in a week. Then she makes a
scatter plot showing the ages of students (in years)
on the x-axis and their heights (in centimeters) on
the y-axis.
1. The red dot has the coordinates (5, 105). What
do you know about the student represented by
this point?
The student is 5 years old and 105 centimeters tall.
2. Based on the graph, how do you think age and height are related?
The graph shows that older kids tend to be taller than younger kids.
Gizmo Warm-up
Because we grow as we get older, a scatter plot of
height vs. age will show that older children are
generally taller than younger children. When two
variables are related, like age and height, they are
said to be correlated.
The Trends in Scatter Plots Gizmo explores different
types of correlation. To begin, check that the slider
is close to the Positive trend side.
1. When there is a positive trend (or positive correlation), do the y-values of the
points on the scatter plot tend to increase or decrease as the x-values
increase? Increase.
2. Move the slider to the Negative trend side. When there is a negative trend (or
negative correlation), how to the y-values change as the x-values increase?
Decrease.
, 3. Move the slider to the middle, under No trend. What does the scatter plot look like now?
The points appear to be placed randomly over the grid, with no apparent trend.
This study source was downloaded by 100000866603821 from CourseHero.com on 06-16-2023 09:07:50 GMT -05:00
2019
Stuvia customers have reviewed more than 700,000 summaries. This how you know that you are buying the best documents.
Quick and easy check-out
You can quickly pay through credit card or Stuvia-credit for the summaries. There is no membership needed.
Focus on what matters
Your fellow students write the study notes themselves, which is why the documents are always reliable and up-to-date. This ensures you quickly get to the core!
Frequently asked questions
What do I get when I buy this document?
You get a PDF, available immediately after your purchase. The purchased document is accessible anytime, anywhere and indefinitely through your profile.
Satisfaction guarantee: how does it work?
Our satisfaction guarantee ensures that you always find a study document that suits you well. You fill out a form, and our customer service team takes care of the rest.
Who am I buying these notes from?
Stuvia is a marketplace, so you are not buying this document from us, but from seller ACADEMICAIDSTORE. Stuvia facilitates payment to the seller.
Will I be stuck with a subscription?
No, you only buy these notes for $9.89. You're not tied to anything after your purchase.