CS MGT6203 Data Analytics for Business Midterm 1 - cheat sheet 2023
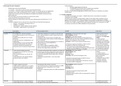
Assumptions of OLS Linearity Assumption: E[Y] = β0 + β1x. We are assuming the expected value of Y for any given X is a linear function of X (approximates to a straight line) 2. Assumption about errors: We assume the error terms are independently and identically distributed (iid) normal random variables with 0 mean and variance σ. 3. Assumptions about predictors: For multiple regression (more than 1 predictor) we assume the predictors are linearly independent. Heteroskedasticity might require transformations (Residuals vs Fitted plot). The sum of the residials will always be 0 if we include intercept terms and use OLS for estimating coefficients. SST = SSE + SSR: Goal: to minimize the sum of squared errors, SSE = ∑ (yi − yˆ)^2 . This is the difference between the actual and the predicted values. Unexplained Variation. Total Variation (SST) = ∑ (yi − y¯) ^2 (observed – mean). Explained Variation (SSR) = ∑(ˆy – y¯) ^2 = ( predicted – mean) = Sum of squared regression. SST = SSE + SSR. R 2 = coefficient of determination, tell you how much of variation is explained by the independent variables in a model = 1-(SSE-SST) = (SSR/SST). We wan p =0.05 Autocorrelation = correlated error terms ( p values will be lower, prediction intervals will be narrower). Use Durbin-Watson to test autocorrelation. QQ plot tests for normality. Multicollinearity : variables are highly correlated. If VIF = 1/(1-R^2)5, then it’s present. Shapiro- Wlk test – non-normality Amount Spent = b0 + b1*X
Written for
Document information
- Uploaded on
- June 20, 2023
- Number of pages
- 2
- Written in
- 2022/2023
- Type
- Exam (elaborations)
- Contains
- Questions & answers
Subjects
- midterm 1 cheat sheet
-
cs mgt6203 data analytics for business
Also available in package deal