Exam (elaborations)
Plotting_Visual_Analytics_Week4_NEC_Solved
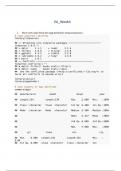
1. Show meta data from the mpg dataframe using summary(). 2. Show metadata from the gapminder dataframe 3. assign ggplot(data = gapminder, mapping = aes(x = gdpPercap, y = lifeExp) to the variable 'p' 4. find the structure of the p object. 5. add () to the p object. Show p. 6. replace () with...
[Show more]


