chapter 4 notes
4A collecting, using and misusing statistical data
A is
population a group of
people, animals or objects with something in common.
A
sample is a group that
has been chosen f ro m a population.
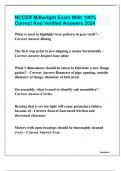
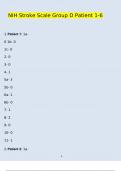
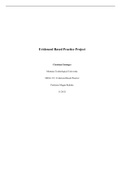
Statistical data can be divided into subgroups
Da 9 +
L
Categorical Numerical
I
I
Discret 2 continuos
om in al Ordinal take
(Data cah <Data can
in
categorisered;limited
value
<categories take on ly a on any
a given ran . a
have no o rd e r number
eg. colours: e.g low, medium, values.
of time t ake n
e.g
a
re d, blue, high) e.g. n u m b e r of to complete
yellow)
children a race)
What
type ofd a t a wo u l d the following survey questions generate?
a) How many televisions do you have in your home?
b) To what
type of music do
you l i ke
most to listen?
The an swe r to the question is a number with limited number
a) Numerical and discrete
values; i n
of this case, a whole n u m b e r.
b) categorical and nominal The a n swe r is a type music
of and these categories have no order.
IB Review ofD a t a Displays
-
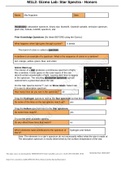
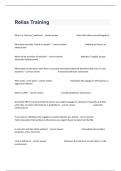
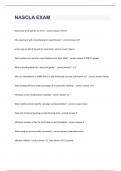
Graphs for a single set of categorical or discrete data
·
Dot
plot
·
column graph ·
Stem and-leaf
plot
5 -
0 13
e 4
-
⑤
1 259
e 3 -
21467
Or
304
C
2 -
I
L I
⑳ 1-
⑧ -
pot ou
&
W
edit 9008exert et
Score
->
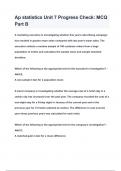
Histograms can be fo r
used grouped discrete or continuous numerical data
f re a 8- -
Score frequency Percent
e
e
8
6 -
30
3
-
1 15
20
S 4 -
2 25 -
3
⑨
8 40 2 I
-
~
-10
4 4 20 0 I
2
- I
I -
, chapter 4 n ote s
4B Review Data
of Displays
-
the t wo common
m o st used 'measures C e n t re '
of are :
i values
(5) of
data
·
sum
=
mean
number of
data values
·
median the middle value When data a re placed in order
-> dataseti s
The mode of
a the data value that
o c c u rs frequently
m o st
->
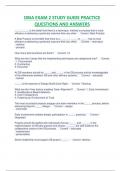
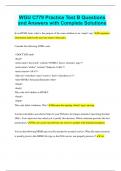
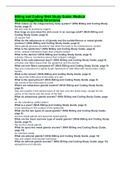
Data can be symmetrical or skewed
Symmetrical
The mean and median will be equal
positively skewed
The median will be less than the mean
Negatively skewed
he median will be greater than the mean
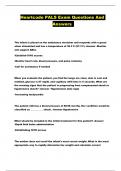
wenty people are surveyed to find h ow
out
many times they use the internet
in a we e k . The
r aw data a re listed.
21, 19, 5, 10, 15, 18, 31, 40, 32, 25, 11, 28, 31, 29, 19.2, 13, 33, 14,24
a) Organise the data into a frequency table using class inter vals 1 0.
of Include a percentage
frequency column.
b) Constructa histogram fo r the data, showing both the
frequency and the percentage
frequency on the one graph
c) Construc t
a stem-and-leaf fo r
plot the data
a) use your stem-and-leaf plot to find the median
4A collecting, using and misusing statistical data
A is
population a group of
people, animals or objects with something in common.
A
sample is a group that
has been chosen f ro m a population.
Statistical data can be divided into subgroups
Da 9 +
L
Categorical Numerical
I
I
Discret 2 continuos
om in al Ordinal take
(Data cah <Data can
in
categorisered;limited
value
<categories take on ly a on any
a given ran . a
have no o rd e r number
eg. colours: e.g low, medium, values.
of time t ake n
e.g
a
re d, blue, high) e.g. n u m b e r of to complete
yellow)
children a race)
What
type ofd a t a wo u l d the following survey questions generate?
a) How many televisions do you have in your home?
b) To what
type of music do
you l i ke
most to listen?
The an swe r to the question is a number with limited number
a) Numerical and discrete
values; i n
of this case, a whole n u m b e r.
b) categorical and nominal The a n swe r is a type music
of and these categories have no order.
IB Review ofD a t a Displays
-
Graphs for a single set of categorical or discrete data
·
Dot
plot
·
column graph ·
Stem and-leaf
plot
5 -
0 13
e 4
-
⑤
1 259
e 3 -
21467
Or
304
C
2 -
I
L I
⑳ 1-
⑧ -
pot ou
&
W
edit 9008exert et
Score
->
Histograms can be fo r
used grouped discrete or continuous numerical data
f re a 8- -
Score frequency Percent
e
e
8
6 -
30
3
-
1 15
20
S 4 -
2 25 -
3
⑨
8 40 2 I
-
~
-10
4 4 20 0 I
2
- I
I -
, chapter 4 n ote s
4B Review Data
of Displays
-
the t wo common
m o st used 'measures C e n t re '
of are :
i values
(5) of
data
·
sum
=
mean
number of
data values
·
median the middle value When data a re placed in order
-> dataseti s
The mode of
a the data value that
o c c u rs frequently
m o st
->
Data can be symmetrical or skewed
Symmetrical
The mean and median will be equal
positively skewed
The median will be less than the mean
Negatively skewed
he median will be greater than the mean
wenty people are surveyed to find h ow
out
many times they use the internet
in a we e k . The
r aw data a re listed.
21, 19, 5, 10, 15, 18, 31, 40, 32, 25, 11, 28, 31, 29, 19.2, 13, 33, 14,24
a) Organise the data into a frequency table using class inter vals 1 0.
of Include a percentage
frequency column.
b) Constructa histogram fo r the data, showing both the
frequency and the percentage
frequency on the one graph
c) Construc t
a stem-and-leaf fo r
plot the data
a) use your stem-and-leaf plot to find the median