Other
MATH302 Week 5 Discussion; Confidence Intervals and Sample Size
Rating
Sold
-
Pages
2
Uploaded on
17-12-2023
Written in
2023/2024
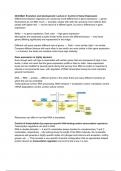
Using the data set you collected in Week 1, excluding the super car outlier, you should have calculated the mean and standard deviation during Week 2 for price data. Along with finding a p and q from Week 3. Using this information, calculate two 95% confidence intervals. For the first interval you need to calculate a T-confidence interval for the sample population. You have the mean, standard deviation and the sample size, all you have left to find is the T-critical value and you can calculate the interval. For the second interval calculate a proportion confidence interval using the proportion of the number of cars that fall below the average. You have the p, q, and n, all that is left is calculating a Z-critical value,
Show more
Read less
Institution
American Public University
Course
MATH302 (MATH302)
Whoops! We can’t load your doc right now. Try again or contact support.
Written for
- Institution
-
American Public University
- Course
-
MATH302 (MATH302)
Document information
- Uploaded on
- December 17, 2023
- Number of pages
- 2
- Written in
- 2023/2024
- Type
- Other
- Person
- Unknown
$18.49
Get access to the full document:
100% satisfaction guarantee
Immediately available after payment
Both online and in PDF
No strings attached