SOLUTIONS MANUAL
Economics for Today 11th Edition by Irvin Tucker
Chapter 01: Applying Graphs to Economics.
Table of Contents
Purpose and Perspective of the Chapter ....................................................................................... 2
Cengage Supplements ..................................................................................................................... 2
Key Terms .......................................................................................................................................... 2
What’s New in This Chapter ............................................................................................................. 3
Chapter Outline ................................................................................................................................. 3
Discussion Questions ....................................................................................................................... 3
Additional Activities and Assignments ........................................................................................... 4
Appendix ............................................................................................................................................ 7
Generic Rubrics ............................................................................................................................................. 7
Standard Writing Rubric ............................................................................................................................... 7
Standard Discussion Rubric........................................................................................................................... 8
,Chapter 01: Applying Graphs to Economics
Purpose and Perspective of the Chapter
The purpose of the Appendix to Chapter 01 is to examine how economic models and
principles can be expressed graphically. In economics, graphs are used as visual aids to
illustrate relationships between economic variables. If a relationship exists between two
variables, then the relationship can be either direct (also known as a positive relationship)
or inverse (also known as a negative relationship).
A direct relationship between two variables means that as one variable increases, this
causes the other variable to also increase in value, and vice versa. A direct relationship is
illustrated graphically as an upward sloping, or positively sloped line or curve.
An inverse relationship between two variables means that as one variable increases, this
causes the other variable to decrease in value, and vice versa. An inverse relationship is
illustrated graphically as a downward sloping, or negatively sloped line or curve.
An independent relationship means there is no relationship between two variables. When
one variable changes, the other remains unchanged.
A shift in a curve (or line) occurs when the ceteris paribus assumption is relaxed and a third
variable, not on either axis of the graph, is allowed to change.
Cengage Supplements
The following product-level supplements provide additional information that may help you
in preparing your course. They are available in the Instructor Resource Center.
• PowerPoint Slides
• Test Bank
[return to top]
Key Terms
Direct relationship: A positive association between two variables. When one variable
increases, the other variable increases, and when one variable decreases, the other
variable decreases.
Independent relationship: A zero association between two variables. When one variable
changes, the other variable remains unchanged.
Inverse relationship: A negative association between two variables. When one variable
increases, the other variable decreases, and vice versa.
Slope: The ratio of the change in the variable on the vertical axis (the rise or fall) to the
change in the variable on the horizontal axis (the run).
[return to top]
,Chapter 01: Applying Graphs to Economics
What’s New in This Chapter
The following elements are improvements in this chapter from the previous edition:
• The “Conclusion” statements of the previous edition have been replaced with “Take
Note” statements. These Take Note statements have been carefully designed and
updated to highlight key concepts and are strategically placed within the appendix
to this chapter to enhance pedagogy. Students will be able to use these to
remember key points when reviewing the appendix to this chapter and studying for
quizzes and tests. A summary of these Take Note statements is provided at the end
of the Appendix to Chapter 01.
[return to top]
Chapter Outline
1A-1 A Direct Relationship
Exhibit A-1 “A Direct Relationship between Variables”
1A-2 An Inverse Relationship
Exhibit A-2 “An Inverse Relationship between Variables”
1A-3 The Slope of a Straight Line
Exhibit A-3 “An Independent Relationship between Variables”
1A-4 A Three-Variable Relationship in One Graph
Exhibit A-4 “Changes in Price, Quantity, and Income in Two Dimensions”
1A-5 A Helpful Study Hint for Using Graphs
[return to top]
Discussion Questions
You can assign these questions several ways: in a discussion forum in your LMS; as whole-
class discussions in person; or as a partner or group activity in class.
1. What is the relationship between the annual sale of umbrellas and the annual amount
of rainfall received in inches? How would this relationship be graphed?
ANSWER: Direct relationship. The line or curve slopes upward (positive slope). The
variable “annual sale of umbrellas” would be placed on the vertical axis (or “Y” axis)
because it is the dependent variable, while the variable “annual amount of rainfall
received in inches” would be placed on the horizontal (or “X” axis) because it is the
independent variable.
, Chapter 01: Applying Graphs to Economics
2. What is the relationship between a student's grade point average and the number of
hours spent studying per week? How would this relationship be graphed?
ANSWER: Direct relationship. The line or curve slopes upward (positive slope). The
variable “grade point average” would be placed on the vertical axis (or “Y” axis) because
it is the dependent variable while the variable “hours spent studying per week” would
be placed on the horizontal (or “X” axis) because it is the independent variable.
3. What is the relationship between tuition and student enrollment at a university? How
would this relationship be graphed?
ANSWER: Inverse relationship. The line or curve slopes downward (negative slope). The
variable “student enrollment” would be placed on the vertical axis (or “Y” axis) because
it is the dependent variable, while the variable "tuition" would be placed on the
horizontal (or “X” axis) because it is the independent variable.
[return to top]
Additional Activities and Assignments
I. Answers to even-numbered end-of-chapter Study Questions and Problems:
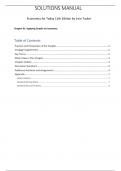
2. (a) There is an inverse relationship between the price per hamburger and the quantity
consumers will purchase at each alternative price.
(b) The numerical table is:
Price per Quantity of hamburgers
hamburger demanded per year
$4.00 20,000
3.00 40,000
2.00 60,000
1.00 80,000
(c) Most students will prefer the graphical model because of its clarity. See Figure 1A-1
below.
Figure 1A-1
The benefits of buying summaries with Stuvia:
Guaranteed quality through customer reviews
Stuvia customers have reviewed more than 700,000 summaries. This how you know that you are buying the best documents.
Quick and easy check-out
You can quickly pay through credit card or Stuvia-credit for the summaries. There is no membership needed.
Focus on what matters
Your fellow students write the study notes themselves, which is why the documents are always reliable and up-to-date. This ensures you quickly get to the core!
Frequently asked questions
What do I get when I buy this document?
You get a PDF, available immediately after your purchase. The purchased document is accessible anytime, anywhere and indefinitely through your profile.
Satisfaction guarantee: how does it work?
Our satisfaction guarantee ensures that you always find a study document that suits you well. You fill out a form, and our customer service team takes care of the rest.
Who am I buying these notes from?
Stuvia is a marketplace, so you are not buying this document from us, but from seller docusity. Stuvia facilitates payment to the seller.
Will I be stuck with a subscription?
No, you only buy these notes for $19.99. You're not tied to anything after your purchase.